
Published 2 November 2026 · By Jatin Dua, Broker of Record, RE/MAX Quantum Realty
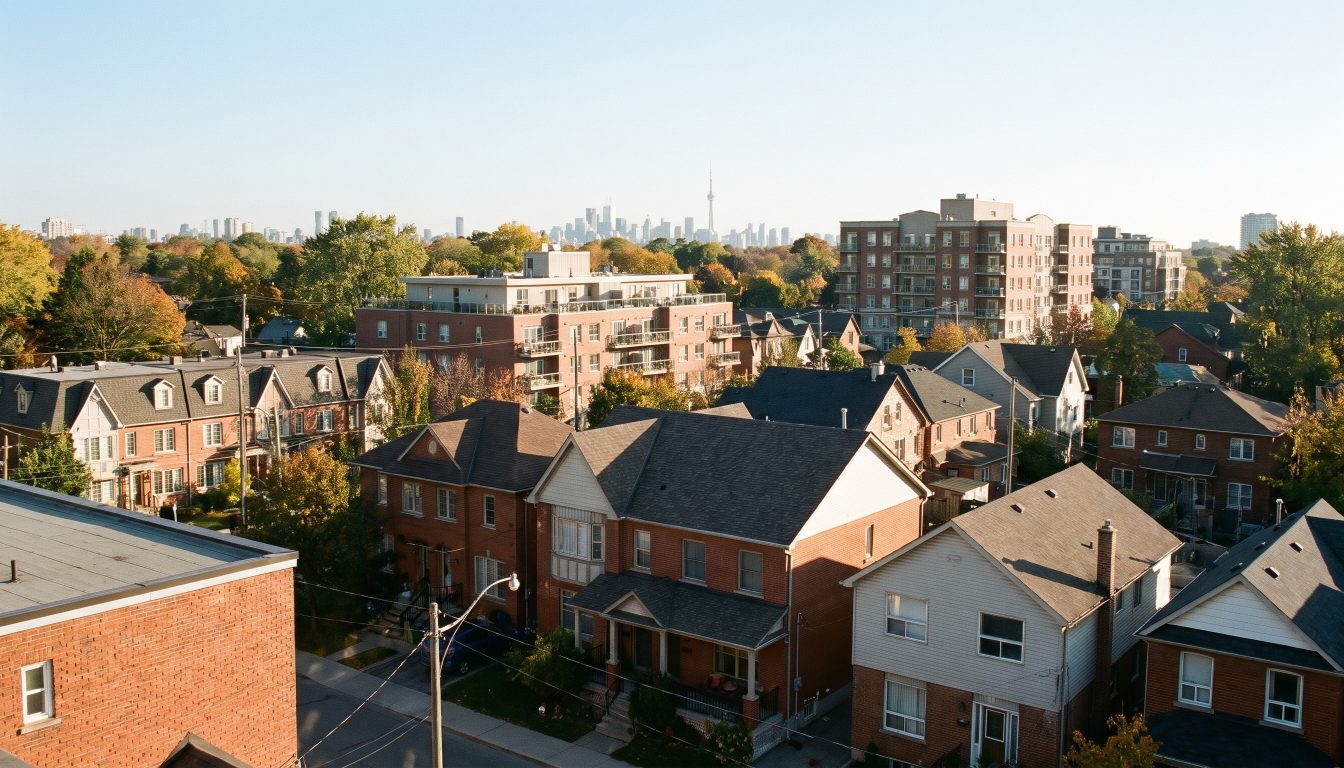
TRREB reported 52,694 GTA home sales from January to October 2026, about 1.8% fewer than the same months of 2025. The City of Toronto had 19,648 sales, Mississauga 4,631 and Brampton 4,037. York Region was the only region with clearly more sales than 2025, while Durham fell about 11%.
This guide is for anyone who wants a straight count of how many homes sold in Toronto and each GTA city in 2026, and what those numbers say about 2027. You get TRREB’s official monthly totals, a city-by-city and district-by-district table, and what the counts mean for buyers and sellers.
How many homes sold in the GTA in 2026?
TRREB reported 52,694 home sales through its MLS System from January to October 2026. That is about 1.8% fewer than the 53,680 sales in the same ten months of 2025, adding up TRREB’s monthly figures. These counts cover all home types in TRREB’s whole market area, which also takes in Dufferin County and part of Simcoe County.
All 2026 figures in this post are January to October only. November and December 2026 had not happened yet when TRREB released its October report on 4 November 2026.
| Month | 2025 sales | 2026 sales | Change |
|---|---|---|---|
| January | 3,819 | 3,044 | -20.3% |
| February | 4,127 | 3,833 | -7.1% |
| March | 4,956 | 4,992 | +0.7% |
| April | 5,555 | 5,916 | +6.5% |
| May | 6,195 | 6,544 | +5.6% |
| June | 6,191 | 6,730 | +8.7% |
| July | 6,046 | 5,964 | -1.4% |
| August | 5,168 | 5,034 | -2.6% |
| September | 5,540 | 5,034 | -9.1% |
| October | 6,083 | 5,603 | -7.9% |
| January–October | 53,680 | 52,694 | -1.8% |
Source: TRREB Market Watch, October 2026 (monthly sales, all home types, all TRREB areas). TRREB revises past months, so totals can differ slightly from earlier reports.
The year had two halves. Sales were well below 2025 in January and February, then ran ahead of 2025 from March to June. From July on, sales slipped back below last year. October 2026 had 5,603 sales, down 7.9% from October 2025, though TRREB said sales were up from September after adjusting for the season.
How many homes sold in each GTA region?
For a city-by-city view, I use TRREB MLS data via REALM for the five main home types: detached, semi-detached, freehold townhouse, condo townhouse and condo apartment. Across Toronto and the 24 other GTA municipalities, those types added up to 50,083 sales from January to October 2026. That is 2.2% fewer than 2025 and 10.3% fewer than 2024.
| Area | Sales 2024 | Sales 2025 | Sales 2026 | 2026 vs 2025 | TRREB count, all home types, 2026 |
|---|---|---|---|---|---|
| City of Toronto | 21,078 | 19,804 | 19,513 | -1.5% | 19,648 |
| Peel | 10,331 | 9,210 | 9,226 | +0.2% | 9,300 |
| York | 10,343 | 9,138 | 9,377 | +2.6% | 9,524 |
| Durham | 7,803 | 6,900 | 6,127 | -11.2% | 6,307 |
| Halton | 6,278 | 6,140 | 5,840 | -4.9% | 5,895 |
| GTA total | 55,833 | 51,192 | 50,083 | -2.2% | 50,674 |
Sources: TRREB MLS data via REALM, January–October of each year (five main home types); last column from TRREB Market Watch, October 2026 (year to date, all home types including links and co-ops). 2026 covers January to October only.
York Region was the only region with a clear gain, up 2.6%. Durham Region had the biggest drop, at 11.2%. Toronto and Peel were close to flat.
How many homes sold in each GTA city in 2026?
Mississauga and Brampton sold the most homes outside Toronto, followed by Markham and Vaughan. The table is sorted by 2026 sales, from most to fewest.
| Municipality (region) | 2024 | 2025 | 2026 | 2026 vs 2025 | 2026 vs 2024 | Detached 2026 | Condo apt 2026 |
|---|---|---|---|---|---|---|---|
| Mississauga (Peel) | 5,161 | 4,646 | 4,602 | -0.9% | -10.8% | 1,798 | 1,213 |
| Brampton (Peel) | 4,453 | 3,938 | 3,999 | +1.5% | -10.2% | 2,280 | 241 |
| Markham (York) | 2,503 | 2,288 | 2,451 | +7.1% | -2.1% | 1,113 | 582 |
| Vaughan (York) | 2,781 | 2,460 | 2,450 | -0.4% | -11.9% | 1,193 | 664 |
| Oakville (Halton) | 2,177 | 2,109 | 2,080 | -1.4% | -4.5% | 1,162 | 335 |
| Burlington (Halton) | 2,028 | 2,017 | 2,022 | +0.2% | -0.3% | 1,034 | 364 |
| Richmond Hill (York) | 1,764 | 1,592 | 1,693 | +6.3% | -4.0% | 838 | 344 |
| Oshawa (Durham) | 2,117 | 1,825 | 1,513 | -17.1% | -28.5% | 1,028 | 77 |
| Milton (Halton) | 1,442 | 1,413 | 1,218 | -13.8% | -15.5% | 583 | 113 |
| Whitby (Durham) | 1,542 | 1,323 | 1,175 | -11.2% | -23.8% | 757 | 90 |
| Clarington (Durham) | 1,372 | 1,130 | 1,040 | -8.0% | -24.2% | 721 | 100 |
| Pickering (Durham) | 1,134 | 1,091 | 1,032 | -5.4% | -9.0% | 546 | 117 |
| Ajax (Durham) | 1,036 | 969 | 852 | -12.1% | -17.8% | 561 | 52 |
| Newmarket (York) | 835 | 724 | 758 | +4.7% | -9.2% | 483 | 51 |
| Caledon (Peel) | 717 | 626 | 625 | -0.2% | -12.8% | 447 | 4 |
| Aurora (York) | 667 | 509 | 539 | +5.9% | -19.2% | 325 | 48 |
| Halton Hills (Halton) | 631 | 601 | 520 | -13.5% | -17.6% | 389 | 19 |
| Georgina (York) | 601 | 565 | 520 | -8.0% | -13.5% | 475 | 7 |
| Whitchurch-Stouffville (York) | 536 | 468 | 445 | -4.9% | -17.0% | 296 | 11 |
| East Gwillimbury (York) | 435 | 364 | 336 | -7.7% | -22.8% | 250 | 1 |
| Scugog (Durham) | 263 | 221 | 216 | -2.3% | -17.9% | 201 | 4 |
| King (York) | 221 | 168 | 185 | +10.1% | -16.3% | 150 | 19 |
| Uxbridge (Durham) | 214 | 203 | 185 | -8.9% | -13.6% | 138 | 11 |
| Brock (Durham) | 125 | 138 | 114 | -17.4% | -8.8% | 108 | 0 |
Source: TRREB MLS data via REALM, January–October 2024, 2025 and 2026 (sales of the five main home types). 2026 covers January to October only.
Notice the mix. In Mississauga, condo apartments made up about a quarter of sales. In Brampton, Caledon, Georgina and East Gwillimbury, detached homes made up most of the market. A city’s total sales tell you how much choice buyers have and how reliable its price figures are. Brock, King and Uxbridge each had fewer than 200 sales in ten months.
Instant Home Valuation
What’s your home
worth today?
Answer six quick questions and get an instant value range built from current Toronto & GTA sale data — property type, size, condition, lot and location all weighted the way a real pricing conversation weighs them. Takes about ninety seconds.
Reading recent GTA sale data…
Building your estimate
Estimated market value
—
$0–$0
Most likely value $0 · roughly $0 per square foot
What moved the number
Starting from the area baseline for your property type, here’s what each answer added or subtracted.
Market context
Recent local averages for comparison.
—
A range is a starting point.
A strategy is what sells.
This model doesn’t know that your neighbour’s identical semi went $80,000 over asking last month, or which two upgrades actually pay back in your area. That conversation is free and takes twenty minutes.
How many homes sold in Toronto in 2026, by district?
The City of Toronto had 19,513 sales of the five main home types from January to October 2026, down 1.5% from 2025. TRREB’s own count across all home types was 19,648. Toronto’s central districts did best: sales there rose 4.2%, while the west districts fell 4.9% and the east districts fell 8.3%.
| District | Includes (examples) | 2024 | 2025 | 2026 | 2026 vs 2025 |
|---|---|---|---|---|---|
| C01 | Downtown west, Trinity-Bellwoods | 2,792 | 2,591 | 2,567 | -0.9% |
| C08 | Church-Yonge, Cabbagetown, Regent Park | 1,416 | 1,287 | 1,374 | +6.8% |
| W08 | Kingsway South, Islington, Markland Wood | 1,244 | 1,125 | 1,039 | -7.6% |
| C15 | Bayview Village, Don Valley Village | 975 | 856 | 965 | +12.7% |
| W06 | Mimico, Long Branch, New Toronto | 869 | 787 | 800 | +1.7% |
| C14 | Willowdale East, Newtonbrook East | 701 | 688 | 718 | +4.4% |
| W05 | Downsview, York University Heights | 744 | 691 | 613 | -11.3% |
| E03 | Danforth, East York | 617 | 630 | 595 | -5.6% |
| C02 | Annex, Casa Loma, Yonge-St. Clair | 580 | 557 | 593 | +6.5% |
| C07 | Willowdale West, Newtonbrook West | 606 | 526 | 591 | +12.4% |
| W02 | Junction, Bloor West Village | 639 | 627 | 589 | -6.1% |
| C04 | Lawrence Park, Bedford Park-Nortown | 548 | 534 | 569 | +6.6% |
| E01 | Riverdale, Greenwood-Coxwell | 570 | 591 | 565 | -4.4% |
| C10 | Mount Pleasant East and West | 557 | 506 | 539 | +6.5% |
| E04 | Dorset Park, Kennedy Park, Wexford | 605 | 544 | 535 | -1.7% |
| E09 | Bendale, Woburn, Morningside | 556 | 526 | 515 | -2.1% |
| C13 | Don Mills, Parkwoods-Donalda | 453 | 476 | 486 | +2.1% |
| W04 | Weston, Maple Leaf, Yorkdale | 539 | 509 | 480 | -5.7% |
| E05 | L’Amoreaux, Tam O’Shanter, Steeles | 513 | 519 | 449 | -13.5% |
| E02 | The Beaches, East End-Danforth | 470 | 476 | 431 | -9.5% |
| E07 | Agincourt, Milliken | 457 | 430 | 414 | -3.7% |
| C03 | Forest Hill South, Yonge-Eglinton | 435 | 427 | 396 | -7.3% |
| W03 | Corso Italia, Keelesdale | 438 | 408 | 387 | -5.1% |
| W01 | High Park-Swansea, Roncesvalles | 406 | 400 | 385 | -3.8% |
| W10 | Rexdale, Thistletown | 394 | 333 | 344 | +3.3% |
| E10 | West Hill, Highland Creek | 397 | 400 | 342 | -14.5% |
| E11 | Malvern, Rouge (part) | 420 | 377 | 310 | -17.8% |
| E08 | Guildwood, Cliffcrest | 397 | 360 | 305 | -15.3% |
| C11 | Leaside, Thorncliffe Park | 324 | 274 | 295 | +7.7% |
| W09 | Humber Heights, Kingsview Village | 313 | 273 | 262 | -4.0% |
| E06 | Birchcliffe-Cliffside, Oakridge | 265 | 275 | 242 | -12.0% |
| C06 | Bathurst Manor, Clanton Park | 259 | 258 | 240 | -7.0% |
| C12 | Bridle Path-Sunnybrook-York Mills | 184 | 185 | 199 | +7.6% |
| W07 | Stonegate-Queensway | 211 | 203 | 196 | -3.4% |
| C09 | Rosedale-Moore Park | 184 | 155 | 183 | +18.1% |
Source: TRREB MLS data via REALM, January–October 2024, 2025 and 2026 (five main home types). Community examples from TRREB’s Q2 2026 community reports; each district includes more areas than listed.
C01, the downtown west district, had by far the most sales, and about 83% of them were condo apartments. C08, the downtown east, was next. Outside the core, W08 in central Etobicoke led with 1,039 sales. Several Scarborough districts, such as E08, E10 and E11, had drops of 14% or more.
Which GTA cities had more sales in 2026, and which had fewer?
Most of the gains were in York Region. Comparing January to October 2026 with 2025:
- More sales: King (+10.1%), Markham (+7.1%), Richmond Hill (+6.3%), Aurora (+5.9%), Newmarket (+4.7%) and Brampton (+1.5%). In Markham, Richmond Hill and Newmarket, detached sales rose by more than 10%.
- Fewer sales: Brock (-17.4%), Oshawa (-17.1%), Milton (-13.8%), Halton Hills (-13.5%), Ajax (-12.1%) and Whitby (-11.2%).
- Inside Toronto: C09 (+18.1%), C15 (+12.7%) and C07 (+12.4%) rose most. E11 (-17.8%), E08 (-15.3%) and E10 (-14.5%) fell most.
More sales in a city usually means buyers are coming back at lower prices. In York Region, detached medians fell by 2% to 11% in 2026, and more buyers stepped in. In Durham, prices also fell, but sales dropped anyway. For a look at how fast homes sold in each city, see the GTA cities where homes sell fastest.
Which home types are selling in the GTA?
Detached homes held steady, and every other type sold less. Detached houses made up almost half of all sales in 2026.
| Home type | 2024 | 2025 | 2026 | 2026 vs 2025 | Share of 2026 sales |
|---|---|---|---|---|---|
| Detached | 24,947 | 23,162 | 23,172 | 0.0% | 46% |
| Semi-detached | 5,019 | 4,978 | 4,709 | -5.4% | 9% |
| Freehold townhouse | 5,377 | 5,048 | 4,726 | -6.4% | 9% |
| Condo townhouse | 4,453 | 3,980 | 3,836 | -3.6% | 8% |
| Condo apartment | 16,037 | 14,024 | 13,640 | -2.7% | 27% |
Source: TRREB MLS data via REALM, January–October 2024, 2025 and 2026, totals for Toronto’s 35 districts and the 24 other GTA municipalities.
Condo apartments are the second-biggest group, but they sold about 15% less than in 2024. For the top of the market, my post on how many $3 million homes sell in Toronto breaks the numbers down further.
Will the GTA hit TRREB’s 2026 sales forecast?
Probably at the low end. In February 2026, TRREB forecast 60,000 to 70,000 GTA home sales for 2026. With 52,694 sales through October, the area needs about 7,300 more in November and December to reach 60,000. In 2025, those two months had 8,630 sales. If 2026 matches that, the full year would land near 61,300, by my own arithmetic. That would be below 2025’s 62,310 sales and well below 2024’s 70,273.
Rates are the wild card. On 28 October 2026, the Bank of Canada raised its policy rate to 2.50% and said it expects housing activity to stay relatively weak. Looking further out, CREA’s October 2026 forecast called for national sales to rise 4.4% in 2027. That forecast came before the rate hike.
This is my own view. Sales counts matter more than most people think. A market with steady sales and fewer listings, like detached homes in York Region, can firm up quickly when buyers return. A market with falling sales and lots of listings, like condo apartments in many areas, will stay slow for longer. I would plan 2027 moves around your own city and home type, not the GTA headline.
What do the 2026 sales counts mean for buyers and sellers?
For buyers, fewer sales and more listings mean more choice and more time. TRREB’s October 2026 report showed 25,098 active listings across its market, down 10% from a year earlier, and 4.6 months of inventory on a trend basis. Fewer listings than a year ago means sellers face a little less competition than in 2025.
For sellers, the count in your own city matters most. Where sales are rising, price close to recent sales and you should find a buyer. Where sales are falling, expect a longer wait and be ready to adjust. You can look up recent sales near you with the tips in how to find sold prices in Toronto.
Small markets can mislead. In a town with fewer than 200 sales in ten months, a few sales more or less can swing the yearly change by 10% or more. Before you read too much into a big jump or drop in a small town, look at the actual number of sales behind it.
What to do next
- Find your city or Toronto district in the tables above and check whether sales rose or fell in 2026.
- Look at sales of your own home type, not just the total.
- If you plan to buy in 2027, get a pre-approval with a rate hold before the Bank of Canada decision on 9 December 2026.
- Read the GTA housing market forecast for 2027 for prices and forecasts by city.
Need help with this? Talk to me.
I’m Jatin Dua, Broker of Record at RE/MAX Quantum Realty, and I’m the best agent to do this kind of work for you in Toronto and across the GTA. Over $100 million in GTA sales and 100+ families helped sell. Feel free to contact me any time: call or text 833-330-1925 or email [email protected].
Frequently asked questions
How many homes sold in Toronto in 2026?
TRREB reported 19,648 home sales in the City of Toronto from January to October 2026, across all home types. Counting the five main types in TRREB MLS data via REALM, Toronto had 19,513 sales, down 1.5% from the same months of 2025. Full-year 2026 figures will come after December.
What is the total number of GTA home sales in 2026 so far?
TRREB reported 52,694 home sales across its market area from January to October 2026, about 1.8% fewer than the same ten months of 2025. That area includes Toronto, Durham, Halton, Peel and York regions, plus Dufferin County and part of Simcoe County. October 2026 alone had 5,603 sales.
Are GTA home sales down in 2026?
Yes, slightly. TRREB’s monthly figures show 52,694 sales from January to October 2026, against 53,680 in the same months of 2025, a drop of about 1.8%. October 2026 sales were down 7.9% from October 2025. Sales were higher than 2025 from March to June but lower in most other months.
Which GTA city had the most home sales in 2026?
Outside Toronto, Mississauga had the most home sales from January to October 2026, with 4,631 across all home types according to TRREB, followed by Brampton with 4,037. The City of Toronto had 19,648. Markham and Vaughan were next, each with about 2,450 to 2,550 sales.
How many homes sold in the GTA in October 2026?
TRREB reported 5,603 home sales in October 2026, down 7.9% from 6,083 in October 2025. New listings fell 11.9% to 14,173. The average selling price was $1,024,108, down 2.7%. After adjusting for the season, sales and prices both edged up from September 2026.
How many homes sold in the GTA in 2025?
TRREB reported 62,310 home sales for all of 2025, at an average price of $1,067,707. That was down from 70,273 sales in 2024. For comparison, 2026 had 52,694 sales from January to October, so the full 2026 total will likely land near or a little below 2025.
Will GTA home sales go up in 2027?
Forecasters expect some recovery, but it is not certain. CREA’s October 2026 forecast calls for Canadian home sales to rise 4.4% in 2027. That forecast came before the Bank of Canada raised its rate to 2.50% on 28 October 2026 and said it expects housing activity to stay relatively weak.
How many condos sold in Toronto in 2026?
About 9,173 condo apartments sold across Toronto’s 35 districts from January to October 2026, based on TRREB MLS data via REALM. That is down 1.3% from 9,295 in 2025 and 13.6% from 10,618 in 2024. Downtown districts C01 and C08 had about 3,400 of those sales.
Where did home sales drop the most in the GTA in 2026?
Durham Region had the biggest drop, with sales of the five main home types down 11.2% from January to October 2026, based on TRREB MLS data via REALM. Brock (-17.4%) and Oshawa (-17.1%) fell most among GTA municipalities. In Toronto, district E11 fell 17.8%.
Sources
- TRREB Market Watch, October 2026
- TRREB news release: Inflation and borrowing costs impacted October GTA real estate market (4 November 2026)
- TRREB: GTA home sales and prices expected to remain stable in 2026 (4 February 2026)
- TRREB Community Reports (district and community names)
- Bank of Canada raises policy rate to 2.50% (28 October 2026)
- CREA quarterly resale housing market forecast (16 October 2026)
Related reading
- GTA Housing Market Forecast 2027: City-by-City Numbers
- Mississauga Housing Market 2027: Prices, Sales and What to Expect
- Brampton Housing Market 2027: Prices, Sales and What to Expect
- Markham and Richmond Hill Housing Market 2027
About the author — Jatin Dua, Toronto and GTA real estate broker
I am Jatin Dua, Broker of Record and co-founder of RE/MAX Quantum Realty Inc., Brokerage, Unit 101, 799 The Queensway, Toronto. I work with buyers and sellers across Toronto and the GTA and have helped more than 100 families sell. Four-plus years of active GTA transactions and over $100 million in sales volume.
Reach me at [email protected] or 833-330-1925, or book a call.