
Published 2 November 2026 · By Jatin Dua, Broker of Record, RE/MAX Quantum Realty
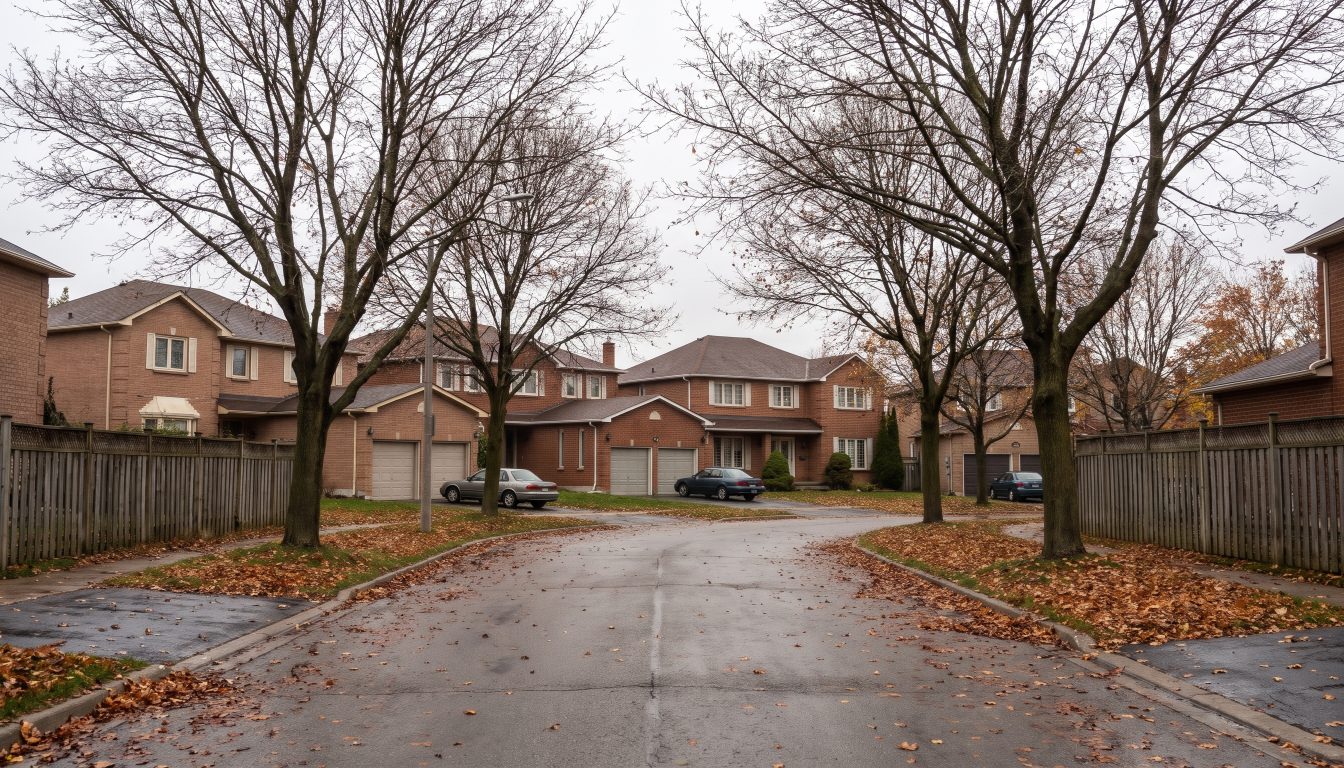
Detached prices fell most in East Gwillimbury (-11.1%), Newmarket (-10.1%), King (-9.1%), Richmond Hill (-8.9%) and Brampton (-8.9%), comparing January to October 2026 with 2025 in TRREB MLS data via REALM. Medians fell in all 24 GTA municipalities outside Toronto, though Burlington was essentially flat.
This guide is for GTA homeowners and buyers who want to know where detached house prices dropped the most in 2026, and what that means for a sale or purchase in 2027. You get the five municipalities with the biggest falls, the real numbers behind each, and how to use them.
Are house prices going down in the GTA?
Yes. Detached prices fell in almost every GTA municipality in 2026. Comparing January to October 2026 with the same months of 2025, the median detached sale price dropped in all 24 GTA towns and cities outside Toronto, according to TRREB MLS data via REALM. Burlington’s drop was just $250, so it was essentially flat. Toronto is reported by district rather than as one city.
TRREB’s own monthly numbers tell the same story. In September 2026, the average GTA selling price across all home types was $1,006,409, down about 5% from $1,060,036 a year earlier, and sales were down 9%. TRREB described buyers as being in a holding pattern. Then on 28 October 2026, the Bank of Canada raised its policy rate to 2.50%, its first increase in more than three years, and the big banks’ prime rate rose to 4.70%.
How did I rank the GTA cities where detached prices fell most?
I compared the median detached sale price for January to October 2026 with the same ten months of 2025. A median is the middle sale: half sold for more and half for less. It is less skewed by a few very large sales than an average.
- GTA only. I included municipalities in Toronto’s four surrounding regions: Peel, York, Durham and Halton. Mono, Orangeville and Hamilton are in TRREB’s data but outside the GTA, so I left them out.
- Toronto separately. TRREB reports Toronto by district, not as one number, so I cover it further down.
- Real sample sizes. All five places below had at least 140 detached sales in 2026, so these are not one-off swings from a handful of deals.
This is a look back at prices, not a forecast. A town-wide median also hides big differences between streets, lot sizes and house ages.
1. East Gwillimbury: down 11.1%
East Gwillimbury had the biggest drop. The median detached home sold for $1,125,000 from January to October 2026, down 11.1% from $1,265,000 a year earlier and about 17.2% below $1,359,000 in 2024. Sales fell 9.1%, to 250 from 275, and homes took 38 days on average to sell, up from 31.
The town takes in Holland Landing, Queensville, Sharon and Mount Albert, and has a GO station on the Barrie line. Its population grew 44.4% between the 2016 and 2021 censuses, to 34,637. In my view, fast growth means a lot of newer homes competing for the same pool of buyers, and that shows up in the price.
What it means: Buyers have room to negotiate, especially on homes that have sat for more than a month. Sellers need to price against 2026 sales, not the 2024 peak.
2. Newmarket: down 10.1%
Newmarket’s median detached price fell 10.1%, to $1,070,000 from $1,190,000. That is about 15.4% below the $1,265,000 median in 2024. Yet sales went up: 483 detached homes sold, 10.3% more than a year earlier, and homes still sold in about 27 days on average.
Newmarket is the seat of York Region, with a population of 87,942 in the 2021 census and a GO station with service south to Toronto and north to Barrie. Rising sales alongside falling prices suggest buyers came back once prices reset. Aurora, next door, fell only 2.0%, so the two neighbours have moved very differently.
What it means: Newmarket is a working market, not a frozen one. Well-priced homes are selling quickly.
3. King: down 9.1%
King had the biggest dollar drop on this list. The median detached home sold for $1,850,000, down 9.1% from $2,035,000, a fall of $185,000. It was $2,120,000 in 2024. Sales edged up to 150 from 142, but homes took 47 days on average to sell, the slowest of the five.
King is a luxury and acreage market, so every sale is different and the median moves more from year to year. My guide on choosing a realtor in King City covers what is unusual about selling there.
What it means: At this price level, slow sales give buyers time and leverage. Sellers should expect a longer listing period and plan their move around it.
Instant Home Valuation
What’s your home
worth today?
Answer six quick questions and get an instant value range built from current Toronto & GTA sale data — property type, size, condition, lot and location all weighted the way a real pricing conversation weighs them. Takes about ninety seconds.
Reading recent GTA sale data…
Building your estimate
Estimated market value
—
$0–$0
Most likely value $0 · roughly $0 per square foot
What moved the number
Starting from the area baseline for your property type, here’s what each answer added or subtracted.
Market context
Recent local averages for comparison.
—
A range is a starting point.
A strategy is what sells.
This model doesn’t know that your neighbour’s identical semi went $80,000 over asking last month, or which two upgrades actually pay back in your area. That conversation is free and takes twenty minutes.
4. Richmond Hill: down 8.9%
Richmond Hill’s median detached price fell 8.9%, to $1,485,000 from $1,630,000, a drop of $145,000. Over two years the fall is about 16.3%, from $1,774,400 in 2024. But sales rose 10.7%, to 838, and homes sold in about 31 days on average, close to last year’s pace.
What it means: Like Newmarket, Richmond Hill buyers are active again at lower prices. For the full picture, including condos and townhouses, see my Markham and Richmond Hill market outlook for 2027.
5. Brampton: down 8.9%
Brampton’s median detached price fell 8.9%, to $950,000 from $1,042,750. It is about 15.7% below the $1,127,250 median in 2024, and now sits under $1 million. Brampton is also the busiest detached market in the GTA outside Toronto, with 2,280 sales from January to October 2026, up 9.0% from a year earlier. Homes took about 30 days on average to sell.
Brampton and Richmond Hill fell by almost exactly the same percentage. I list Brampton fifth only because its drop was a hair smaller once you go past one decimal. My Brampton housing market outlook breaks the city down by home type.
What it means: A sub-$1 million median and rising sales make Brampton one of the more active detached markets heading into 2027.
How do these five compare with the rest of the GTA?
| Detached, Jan–Oct | 2024 median | 2025 median | 2026 median | Change vs 2025 | 2026 sales | Avg days on market 2026 |
|---|---|---|---|---|---|---|
| East Gwillimbury | $1,359,000 | $1,265,000 | $1,125,000 | -11.1% | 250 | 38 |
| Newmarket | $1,265,000 | $1,190,000 | $1,070,000 | -10.1% | 483 | 27 |
| King | $2,120,000 | $2,035,000 | $1,850,000 | -9.1% | 150 | 47 |
| Richmond Hill | $1,774,400 | $1,630,000 | $1,485,000 | -8.9% | 838 | 31 |
| Brampton | $1,127,250 | $1,042,750 | $950,000 | -8.9% | 2,280 | 30 |
| Burlington (for contrast) | $1,325,000 | $1,250,000 | $1,249,750 | 0.0% | 1,034 | 29 |
Source: TRREB MLS data via REALM, January–October 2026 vs the same period of 2025 and 2024. Medians cover each whole municipality.
Just outside the top five were Oshawa and Uxbridge, both down 8.8%, then Halton Hills at 8.3% and Pickering at 8.0%. At the other end, Burlington’s median was flat, and Aurora (-2.0%), Georgina (-2.1%) and Oakville (-3.0%) held up best. I cover the steadiest areas in where GTA home prices held up best.
Inside Toronto, several districts fell further than any 905 city. Detached medians dropped 13.9% in E11 (Malvern and Rouge), 13.6% in C06 and 12.7% in E08, on much smaller numbers of sales. My post on the Toronto areas where prices fell most goes district by district.
Why did detached prices fall most in York Region?
Four of the five biggest drops were in York Region. The data shows what happened, not why, so treat what follows as my view. These were among the most expensive detached markets in 2024, and higher price points are hit hardest when borrowing costs and qualifying rules squeeze what buyers can carry. A buyer who needs a $1.2 million mortgage feels every rate change more than one borrowing $600,000.
The sales numbers matter too. In Newmarket, Richmond Hill and Brampton, sales rose while prices fell, which looks like a market resetting to a level buyers will pay. In East Gwillimbury, sales fell along with prices and homes took longer to sell, which points to more choice than buyers.
Will GTA detached prices keep falling in 2027?
Nobody knows for sure, and I would be wary of anyone who claims to. Here is what the main forecasters said as of late 2026:
- CREA forecast in October 2026 that the national average price would rise about 1.2% in 2027, with sales up 4.4%. That forecast came out before the Bank of Canada’s rate increase.
- The Bank of Canada said on 28 October 2026 that it expects housing to remain relatively weak. Its next rate decision is on 9 December 2026.
In my view, the cities that fell most are now the ones where a buyer has the most leverage, but that does not mean prices have bottomed. If rates rise again, prices could slip further. For the wider picture, see my GTA housing market forecast for 2027.
A town-wide median is not your home’s value. In a place like King or East Gwillimbury, one large estate or a batch of new-build sales can move the median a lot. Before you list or make an offer, compare recent sales of similar homes on similar lots, not the headline percentage.
If you are selling in one of these five places, the biggest mistake I see is pricing off what a neighbour got in 2024. Price against the last three to six months of real sales, and you will usually net more than if you start high and chase the market down. If you are buying, these are the markets where conditions on financing and inspection are easier to get, so use them.
What to do next
- Look up your town’s 2026 median in the table above and compare it with what you paid or plan to pay.
- Run the home estimator above to see where your own house sits against recent sales.
- If you are buying, get a pre-approval that reflects the October 2026 rate increase before you make offers.
- If you are selling, ask for a pricing review based on sales from the last three to six months, not last year’s peak.
- Watch the Bank of Canada decision on 9 December 2026, which may affect what buyers can borrow in early 2027.
Need help with this? Talk to me.
I’m Jatin Dua, Broker of Record at RE/MAX Quantum Realty, and I’m the best agent to do this kind of work for you in Toronto and across the GTA. Over $100 million in GTA sales and 100+ families helped sell. Feel free to contact me any time: call or text 833-330-1925 or email [email protected].
Frequently asked questions
Are house prices going down in the GTA in 2026?
Yes. The median detached price fell in all 24 GTA municipalities outside Toronto from January to October 2026 compared with 2025, according to TRREB MLS data via REALM. The biggest drops were in East Gwillimbury (-11.1%) and Newmarket (-10.1%). TRREB’s September 2026 GTA average price, across all home types, was down about 5% year over year.
Which GTA city had the biggest drop in detached house prices in 2026?
East Gwillimbury had the biggest drop. Its median detached price fell 11.1%, to $1,125,000 from $1,265,000, comparing January to October 2026 with the same months of 2025, per TRREB MLS data via REALM. Detached homes there took 38 days on average to sell in 2026, up from 31 days a year earlier.
How much did detached house prices drop in Brampton in 2026?
Brampton’s median detached price fell 8.9%, to $950,000 from $1,042,750, from January to October 2026 compared with 2025, according to TRREB MLS data via REALM. It is about 15.7% below the 2024 median of $1,127,250. Sales rose 9.0% to 2,280, the most of any GTA municipality outside Toronto.
How much have house prices dropped in Richmond Hill?
Richmond Hill’s median detached price fell 8.9%, to $1,485,000 from $1,630,000, comparing January to October 2026 with 2025, per TRREB MLS data via REALM. That is a drop of $145,000 in one year and about 16.3% since 2024. Sales still rose 10.7%, to 838 homes, so buyers are active at the lower prices.
Are house prices dropping in Ontario?
In most of the GTA, yes. Detached medians fell in nearly every GTA municipality in 2026, per TRREB MLS data via REALM, and TRREB’s September 2026 GTA average price was down about 5% year over year. Nationally, CREA forecast in October 2026 that average prices would be roughly flat in 2026 and up about 1.2% in 2027.
Where did detached house prices hold up best in the GTA in 2026?
Burlington held up best. Its median detached price was $1,249,750 from January to October 2026, essentially unchanged from $1,250,000 a year earlier, according to TRREB MLS data via REALM. Aurora (-2.0%), Georgina (-2.1%) and Oakville (-3.0%) also fell far less than the GTA’s hardest-hit towns.
Will GTA house prices drop more in 2027?
No one can say for sure. CREA forecast a small national price gain of about 1.2% for 2027, but that was before the Bank of Canada raised its rate to 2.50% on 28 October 2026. The Bank said it expects housing to remain relatively weak. Its next decision is on 9 December 2026, and another increase would put more pressure on prices.
Why are detached house prices falling in York Region?
TRREB data shows the drops but not their cause. In my view, York Region towns such as Richmond Hill, King and Newmarket had some of the highest detached prices in 2024, and expensive homes are hit hardest when borrowing costs rise. Four of the five biggest GTA drops in 2026 were in York Region.
Is 2027 a good time to buy a detached house in the GTA?
For buyers, 2027 may offer more leverage than recent years in the towns where prices fell most, such as East Gwillimbury and Newmarket. That is my view, not a promise that prices have bottomed. Get a pre-approval that reflects the October 2026 rate increase, compare recent sales of similar homes, and only buy what you can carry if rates rise again.
Sources
- TRREB Market Watch, September 2026
- Bank of Canada: Interest rate announcement, 28 October 2026
- Advisor.ca: CREA downgrades home sales forecast for the third time this year
- Wikipedia: East Gwillimbury
- Wikipedia: Newmarket, Ontario
Related reading
- Top 5 Best Neighbourhoods to Live in Mississauga in 2027
- Top 5 Best Neighbourhoods to Live in Brampton in 2027
- Top 5 Best Neighbourhoods to Live in Markham in 2027
- Top 5 Best Neighbourhoods to Live in Oakville in 2027
About the author — Jatin Dua, Toronto and GTA real estate broker
I am Jatin Dua, Broker of Record and co-founder of RE/MAX Quantum Realty Inc., Brokerage, Unit 101, 799 The Queensway, Toronto. I work with buyers and sellers across Toronto and the GTA and have helped more than 100 families sell. Four-plus years of active GTA transactions and over $100 million in sales volume.
Reach me at [email protected] or 833-330-1925, or book a call.