
Published 30 October 2026 · By Jatin Dua, Broker of Record, RE/MAX Quantum Realty
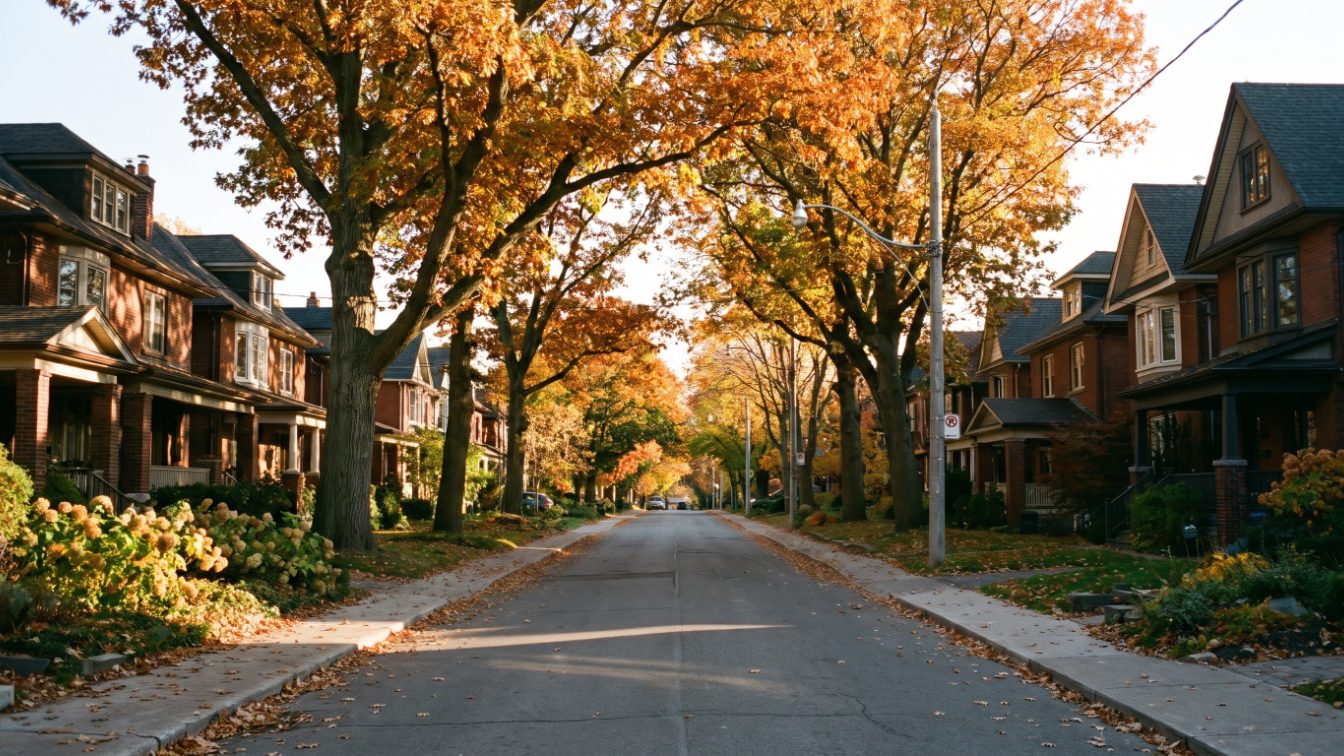
Based on TRREB’s MLS® HPI composite benchmark for September 2026 vs September 2025, prices held up best in W06 Mimico and Long Branch (+1.24%), W08 Kingsway and Islington (+0.12%), C10 Mount Pleasant and Davisville (−0.78%), W09 Kingsview Village and Humber Heights (−0.79%) and C02 Annex and Summerhill (−0.92%). The GTA as a whole fell 4.65%. These are district averages. The order follows the benchmark change.
How I chose these five
I ranked every TRREB area in the GTA by the year-over-year change in its MLS® Home Price Index (HPI) composite benchmark, comparing September 2026 with September 2025. The source is TRREB’s Market Watch for September 2026, released October 6, 2026, the latest monthly report available as I write this.
Across all TRREB areas the composite benchmark was down 4.65% over that year, and the City of Toronto was down 3.84%. Against that backdrop, holding up means falling much less than the market, or not falling at all.
All five that came out on top are Toronto districts. Every figure is a district average for the whole TRREB district (for example W06 or C10), not a value for any one neighbourhood, street or building.
- Measure: MLS® HPI composite benchmark, September 2026 vs September 2025. The benchmark adjusts for the mix of homes sold, so it is a fairer comparison than an average price.
- Left out: W07 (Stonegate-Queensway) showed +2.45% in TRREB’s table, but its benchmark has no townhouse component, so I did not rank it.
- Best outside Toronto: Orangeville (−2.60%), Burlington (−2.81%) and Oakville (−3.03%) held up best among the municipalities TRREB reports.
- Extra context: sales, median and average prices and months of inventory come from my TRREB-based market data pages for the same month.
1. Toronto W06 (Mimico, New Toronto, Long Branch and Alderwood)
What the numbers show
W06 was the strongest fully reported area in the GTA. Its composite benchmark was $832,100 in September 2026, up 1.24% from September 2025, while most of the region was down.
The gain came from houses. The detached benchmark rose 1.41% to $1,155,500 and attached homes rose 3.42% to $1,122,700, while townhouses fell 8.90% to $776,000 and apartments slipped 1.17% to $607,800.
Activity and supply
Eighty-two homes sold in September 2026, down 9.9% from a year earlier, at a median of $756,250 and an average of $891,517. Homes sold at 98% of list price after 35 days on average.
Supply is not tight: there were 414 homes for sale at month end and 4.6 months of inventory. Condo apartments were nearly half the sales, with 40 sold at a median of $557,500. In the same month 277 homes were newly listed, and TRREB’s sales-to-new-listings ratio, a 12-month moving average, was 37.8%.
What it means for buyers and sellers
W06 shows that the house and condo markets can move in different directions inside one district. A detached owner and a condo owner in W06 should each look at their own segment rather than the headline. Detached homes had 25 sales here at a median of $1,200,000.
2. Toronto W08 (Islington-City Centre West, the Kingsway, Humber Valley, Markland Wood and the West Mall area)
What the numbers show
W08’s composite benchmark was essentially flat, at $994,800 in September 2026, up 0.12% year over year. It is one of only two fully reported GTA areas that did not decline.
Attached homes did the lifting, with a benchmark of $1,223,800 (+4.95%). The detached benchmark was $1,623,000 (−1.46%), townhouses $684,700 (−9.00%) and apartments $531,000 (−2.42%).
Activity and supply
W08 was the busiest district on this list, with 110 sales in September 2026, down 9.8% from a year earlier. The median was $807,500 and the average $1,186,441.
Detached homes accounted for 49 of those sales, at a median of $1,282,000, and 58 condo apartments sold at a median of $524,000. Homes sold at 96% of list price after 30 days on average, with 4.2 months of inventory.
There were 496 homes for sale at month end, 7.5% fewer than a year earlier, and the sales-to-new-listings ratio was 40.9%. That puts W08 between balanced and buyer-friendly conditions.
What it means for buyers and sellers
A stable benchmark does not mean homes sell at asking. The 96% sale-to-list ratio says buyers are still negotiating in W08, especially on higher-priced detached homes. Sellers here benefit from steady values but should leave room in their pricing.
3. Toronto C10 (Mount Pleasant East and West, including Davisville)
What the numbers show
C10’s composite benchmark was $928,600 in September 2026, down only 0.78% from a year earlier. It was also one of the few districts where homes sold above list price on average.
By home type, the detached benchmark was $1,946,300 (−6.91%) and attached homes $1,427,400 (−7.26%), but townhouses rose 1.50% to $903,700 and apartments eased only 2.68% to $605,800. Because apartments carry a lot of weight in this district, that small apartment decline kept the composite close to flat.
Activity and supply
Sales rose 20.0% to 54 in September 2026. The median sale price was $1,017,750 and the average $1,114,261.
Homes sold at 101% of list price after 26 days on average, and months of inventory was 3.7, which is balanced. Semi-detached homes were especially competitive, with 13 sales at 105% of list.
Supply did rise: 243 homes were for sale at month end, 7.0% more than in September 2025, and the sales-to-new-listings ratio was 42.0%.
What it means for buyers and sellers
C10 is a reminder that a district can be balanced overall while one segment is still competitive. Buyers after a semi near Davisville should expect competition; buyers of condo apartments, 28 of which sold at a median of $641,500, will usually find more room to negotiate.
4. Toronto W09 (Kingsview Village-The Westway, Willowridge-Martingrove-Richview and Humber Heights)
What the numbers show
W09’s composite benchmark was $922,600 in September 2026, down 0.79% from September 2025, essentially tied with C10.
The detached benchmark was $1,213,200 (−4.42%) and attached homes $903,900 (−7.10%). Townhouses rose 0.88% to $728,700 and apartments fell 4.15% to $450,600.
Activity and supply
W09 is a small market: only 20 homes sold in September 2026, down 9.1% from a year earlier. The median was $887,500 and the average $822,940.
Eleven of those sales were detached homes, at a median of $1,015,000. Homes sold at 98% of list after 43 days on average, with 135 for sale at month end and 4.3 months of inventory.
That inventory figure was 7.1% higher than a year earlier, and the sales-to-new-listings ratio was 41.2%. Condo apartments were a small part of the picture, with eight sales at a median of $407,400.
What it means for buyers and sellers
With so few sales, I treat W09’s ranking with some caution, which is exactly why the benchmark matters here more than the median. For buyers who want a detached house in central Etobicoke, a detached benchmark just over $1.2 million and 43 days on market leave room to take your time.
5. Toronto C02 (the Annex, Summerhill and Wychwood area)
What the numbers show
C02’s composite benchmark was $1,295,900 in September 2026, down 0.92% year over year. It is the most expensive district on this list and held its value better than most.
The detached benchmark was $2,565,300 (−0.89%), attached homes $1,818,500 (−2.48%), townhouses $1,556,700 (+0.91%) and apartments $796,000 (−3.00%).
Activity and supply
Sales rose 31.8% to 58 in September 2026. The median was $1,472,500 and the average $1,773,011, both pulled up by a high-end condo mix: the 30 condo apartments that sold had a median of $1,237,500.
Supply is ample, with 358 homes for sale at month end and 5.7 months of inventory, and homes sold at 98% of list after 38 days on average.
Inventory was 9.4% lower than a year earlier, but the sales-to-new-listings ratio of 35.3% still sits on the buyer’s side. Detached homes were only eight of the sales, at a median of $2,482,500, so the detached benchmark is the better guide for house buyers.
What it means for buyers and sellers
C02 combines stable benchmark values with plenty of choice. That is a good position for buyers who want to negotiate on terms rather than expect a large discount. Semi-detached and freehold townhouses still sold at 101% of list, so the best-located houses remain competitive.
The five at a glance
| District | Benchmark, Sep 2026 | Change vs Sep 2025 | Homes sold, Sep 2026 | Sale-to-list |
|---|---|---|---|---|
| W06 Mimico, New Toronto, Long Branch, Alderwood | $832,100 | +1.24% | 82 | 98% |
| W08 Kingsway, Islington, Markland Wood and area | $994,800 | +0.12% | 110 | 96% |
| C10 Mount Pleasant East and West, Davisville | $928,600 | −0.78% | 54 | 101% |
| W09 Kingsview Village, Richview, Humber Heights | $922,600 | −0.79% | 20 | 98% |
| C02 Annex, Summerhill, Wychwood area | $1,295,900 | −0.92% | 58 | 98% |
Source: TRREB Market Watch, September 2026 (MLS® HPI composite benchmark). Sales and sale-to-list from my district pages for the same TRREB report.
What this means if you’re buying or selling in the GTA
Holding up is relative. Four of these five still recorded small declines, and none rose by more than about 1%. For an owner, that means your home has likely kept its value better than the GTA average; it does not mean it has gained.
For buyers, these districts offer less of a discount than places like Scarborough or parts of York Region, where many benchmarks fell roughly 7% to 10% or more. The upside is that values here have been steadier. Look at whether the home type you want followed the district: in W06, W08 and C10 the townhouse and apartment segments behaved very differently from detached houses.
Location and home type within each district still matter. Every district on this list had both condo apartment and house sales in September 2026, and the home-type benchmarks above moved in different directions. Compare like with like, on your own street or in your own building, before you draw conclusions from the district figure.
For sellers, a steady benchmark is helpful, but sale-to-list ratios of 96% to 98% in most of these districts mean pricing still matters. I am not predicting what happens next; these numbers describe the past year. If you want to see how your own street compares, start with my home valuation page or the buyer’s or seller’s market ranking.
Free tool — AI home value estimator
Instant Home Valuation
What’s your home
worth today?
Answer six quick questions and get an instant value range built from current Toronto & GTA sale data — property type, size, condition, lot and location all weighted the way a real pricing conversation weighs them. Takes about ninety seconds.
Reading recent GTA sale data…
Building your estimate
Estimated market value
—
$0–$0
Most likely value $0 · roughly $0 per square foot
What moved the number
Starting from the area baseline for your property type, here’s what each answer added or subtracted.
Market context
Recent local averages for comparison.
—
A range is a starting point.
A strategy is what sells.
This model doesn’t know that your neighbour’s identical semi went $80,000 over asking last month, or which two upgrades actually pay back in your area. That conversation is free and takes twenty minutes.
Frequently asked questions
Which GTA areas held their value best in 2026?
In TRREB’s September 2026 Market Watch, the composite benchmark rose 1.24% in Toronto W06 (Mimico, New Toronto, Long Branch and Alderwood) and 0.12% in W08 versus September 2025. C10, W09 and C02 each fell less than 1%. Across all TRREB areas the benchmark fell 4.65%, so these five did far better than the region.
Which municipality outside Toronto held up best?
Among municipalities in TRREB’s September 2026 report, Orangeville’s composite benchmark fell 2.60% year over year, Burlington’s 2.81% and Oakville’s 3.03%. All three did better than the 4.65% decline across all TRREB areas, but none matched the Toronto districts on this list.
Did home prices go up anywhere in the GTA in 2026?
Only in a few districts. W06 was up 1.24% and W08 up 0.12% in September 2026 versus September 2025, based on TRREB’s composite benchmark. W07 (Stonegate-Queensway) showed +2.45%, but its benchmark has no townhouse component, so I did not include it in the ranking.
Does a stable district benchmark mean homes sell over asking?
No. In September 2026, homes in W08 sold at 96% of list price on average and in W06 at 98%, even though their benchmarks were flat or slightly up. C10 was the exception on this list, with homes selling at 101% of list after 26 days on average.
Is a TRREB district benchmark the value of my home?
No. It is the price of a typical home across the whole district, adjusted for the mix of sales. Your home’s value depends on its type, size, condition and street, so recent sales of comparable homes nearby are the better guide. In W06, for example, detached and townhouse benchmarks moved in opposite directions.
Sources
- Market Watch, September 2026 — Toronto Regional Real Estate Board
- This Month in the GTA Housing Market: September 2026 — Jatin Dua
- Toronto W06 Real Estate Market: September 2026 — Jatin Dua
- Toronto W08 Real Estate Market: September 2026 — Jatin Dua
- Toronto C10 Real Estate Market: September 2026 — Jatin Dua
- Toronto W09 Real Estate Market: September 2026 — Jatin Dua
- Toronto C02 Real Estate Market: September 2026 — Jatin Dua
- GTA and Toronto Real Estate Market Data — Jatin Dua
Related reading
- Top 5 Toronto Areas Where Condo Rents Fell Most in 2026
- Top 5 GTA Areas for Rental Yield in 2026
- Top 5 GTA Neighbourhoods Near GO Stations for Commuters
- GTA market data by district
About the author — Jatin Dua, Toronto and GTA real estate broker
I am Jatin Dua, Broker of Record and co-founder of RE/MAX Quantum Realty Inc., Brokerage, Unit 101, 799 The Queensway, Toronto. I work with buyers and sellers across Toronto and the GTA and have helped more than 100 families sell. Four-plus years of active GTA transactions and over $100 million in sales volume. Every figure here comes from a published table, regulator or statute linked in the sources, so you can check all of it without asking me.
Reach me at [email protected] or 833-330-1925, or book a call.