
Published 30 October 2026 · By Jatin Dua, Broker of Record, RE/MAX Quantum Realty
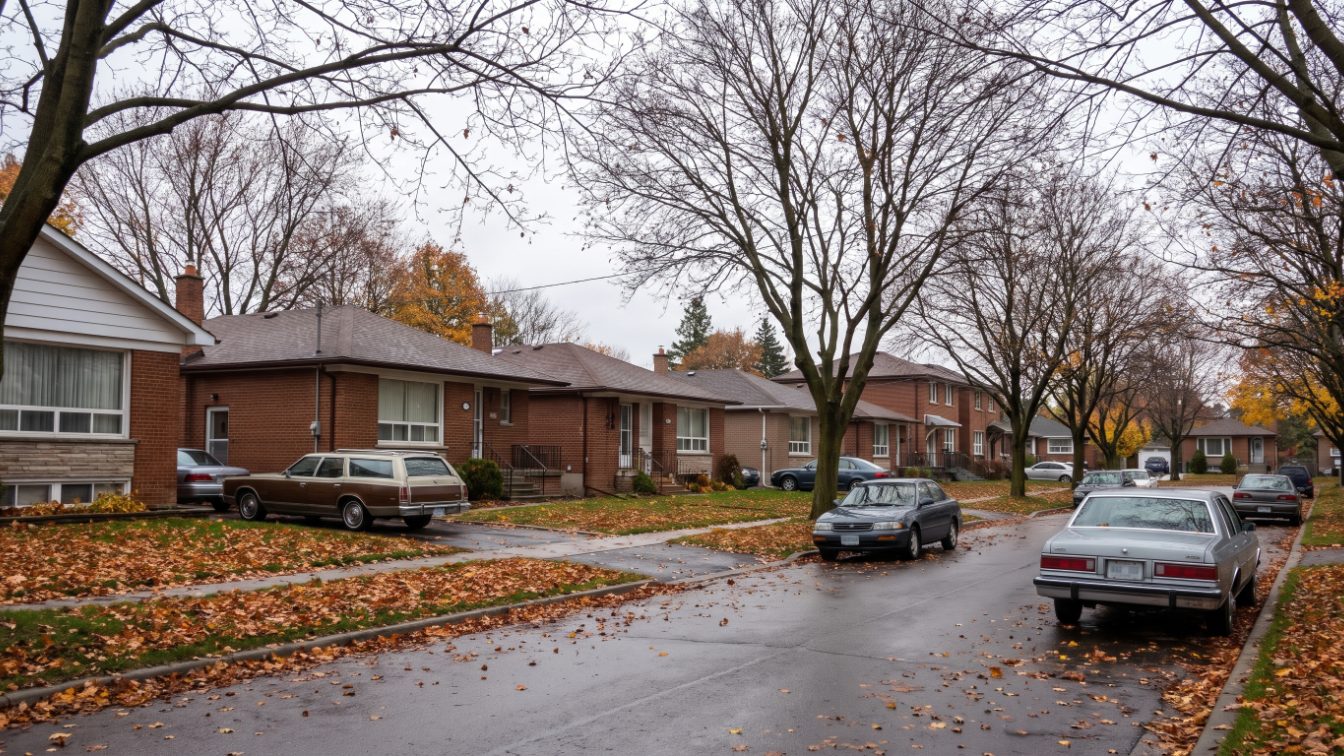
Based on TRREB’s MLS® HPI composite benchmark for September 2026 vs September 2025, prices fell most in E11 Malvern and the Rouge (−9.54%), E04 Wexford-Maryvale and Dorset Park (−8.81%), E08 Scarborough Village and Guildwood (−8.10%), E09 Bendale, Woburn and Morningside (−7.70%) and C08 Church-Yonge and Cabbagetown (−7.49%). These are district averages, not neighbourhood or building values. The order follows the size of the drop.
How I chose these five
I ranked Toronto’s TRREB districts by the year-over-year change in the MLS® Home Price Index (HPI) composite benchmark, comparing September 2026 with September 2025. The source is TRREB’s Market Watch for September 2026, released October 6, 2026, which is the latest monthly report available as I write this.
I used the benchmark rather than the average sale price because the benchmark adjusts for the mix of homes sold. A district’s average can drop in a month simply because more condos and fewer houses sold, and that is not the same as prices falling.
Every figure here is a district average for a whole TRREB district (for example E11 or C08), not a value for a single neighbourhood, street or building. For context, TRREB’s composite benchmark for the City of Toronto was down 3.84% year over year, and for all TRREB areas it was down 4.65%.
- Measure: MLS® HPI composite benchmark, September 2026 vs September 2025.
- Left out: Toronto C06 showed the largest drop in TRREB’s table (−11.27%), but its benchmark has no townhouse component (shown as −100.00%) and only 19 homes sold, so I did not rank it.
- Extra context: sales counts, median and average prices and months of inventory come from my TRREB-based market data pages for the same month.
1. Toronto E11 (Malvern and the Rouge)
What the numbers show
E11 had the steepest fall of any fully reported Toronto district. TRREB put its composite benchmark at $653,600 in September 2026, down 9.54% from September 2025.
The drop was broad across home types. The detached benchmark was $927,300 (−7.22%), attached homes $744,300 (−8.90%), townhouses $554,100 (−13.40%) and apartments $372,000 (−15.94%).
Activity and supply
Only 28 homes sold in E11 in September 2026, down 20.0% from a year earlier. The median sale price was $685,000 and the average was $726,530, with 5.0 months of inventory.
With so few sales, one or two unusual deals can move the median, which is why I lean on the benchmark for the ranking. Condo rents also softened: the average one-bedroom lease in the second quarter of 2026 was $1,979, down 12.1% from the second quarter of 2025, from 42 leases.
What it means for buyers and sellers
For a buyer, E11 is one of the few Toronto districts where the townhouse and apartment benchmarks are well below the $600,000 mark. For a seller, the takeaway is that last year’s comparable sales are not a reliable guide to today’s price, so recent sales on your own street matter more than ever.
2. Toronto E04 (Wexford-Maryvale, Dorset Park, Kennedy Park, Ionview and Clairlea-Birchmount)
What the numbers show
E04’s composite benchmark was $706,800 in September 2026, down 8.81% year over year. The decline showed up in every home type TRREB reports for the district.
The detached benchmark was $861,700 (−9.92%), attached homes $721,100 (−9.58%), townhouses $665,000 (−9.00%) and apartments $419,200 (−8.20%).
Activity and supply
Fifty-two homes sold in E04 in September 2026, down 5.5% from a year earlier. The median sale price was $812,500 and the average $781,534.
Months of inventory stood at 3.7, tighter than most of the districts on this list. That combination, lower benchmark prices but steadier sales, suggests buyers are still active here at the new price level.
Detached homes were the biggest group, with 35 sales at a median of $847,500. Homes sold at 99% of list price on average after 29 days, and there were 239 homes for sale at month end, 10.8% fewer than a year earlier.
What it means for buyers and sellers
Buyers looking for a detached house in Toronto under $900,000 at the benchmark level will find E04 one of the few districts that fits. Sellers should note that the district is not oversupplied, so a home priced in line with recent sales can still move, but asking for 2025 prices is unlikely to work.
3. Toronto E08 (Scarborough Village, Cliffcrest, Guildwood and Eglinton East)
What the numbers show
E08’s composite benchmark fell 8.10% year over year to $782,900 in September 2026. Detached homes, which make up much of this district’s housing, saw the bigger move.
The detached benchmark was $986,800 (−9.89%), attached homes $741,700 (−9.01%), townhouses $618,100 (−7.57%) and apartments $453,000 (−11.46%).
Activity and supply
Thirty-six homes sold in September 2026, down 26.5% from September 2025. The median was $803,000 and the average $900,617.
Months of inventory was 5.4, which puts E08 on the buyer’s side of the market. Fewer sales and more choice usually mean longer days on market and more room to negotiate on conditions.
The detail backs that up. Homes that sold took 41 days on average, sold at 97% of list price, and 206 homes were for sale at month end, 3.0% more than a year earlier. Detached homes accounted for 24 of the 36 sales, at a median of $857,500.
What it means for buyers and sellers
The detached benchmark dipping below $1 million is the headline for buyers who want a detached house in this part of Scarborough. Sellers in E08 should plan for a longer selling period and price against the most recent sales rather than last spring’s.
4. Toronto E09 (Bendale, Woburn and Morningside)
What the numbers show
E09’s composite benchmark was $697,500 in September 2026, down 7.70% from a year earlier. The pattern here is more mixed than in E04 or E08.
The detached benchmark was $877,800 (−7.90%) and attached homes $731,300 (−7.98%), but the townhouse benchmark rose 3.66% to $593,700. Apartments were $434,500 (−8.38%).
Activity and supply
Forty-seven homes sold in E09 in September 2026, down 6.0% year over year. The median sale price was $770,000 and the average $685,353, with 4.6 months of inventory.
The gap between median and average reflects the mix that month: plenty of lower-priced condo sales pulled the average below the median.
Detached homes made up 25 sales at a median of $866,000, and 19 condo apartments sold at a median of $458,000. Homes sold at 99% of list price after 39 days on average, and condo rents eased too: one-bedrooms averaged $2,134 in the second quarter of 2026, down 5.8% from a year earlier.
What it means for buyers and sellers
The townhouse result is a reminder that one district can hold several different markets. If you are buying or selling a townhouse in E09, the district-wide drop overstates what your segment did, so look at townhouse sales specifically.
5. Toronto C08 (Church-Yonge Corridor, Moss Park, Regent Park, Cabbagetown and North St. James Town)
What the numbers show
C08 is the only downtown district in the five. Its composite benchmark was $546,800 in September 2026, down 7.49% year over year, reflecting how heavily condo apartments weigh in this district.
The apartment benchmark was $497,900 (−5.51%) and townhouses $828,000 (−9.55%). TRREB also reports large drops for detached (−21.18%) and attached (−18.21%) homes, but those segments are a small slice of C08’s sales, so I would not read much into them.
Activity and supply
C08 was busy despite falling prices: 146 homes sold in September 2026, up 5.0% from a year earlier, including 131 condo apartments. The median sale price was $562,500 and the average $646,347.
Months of inventory was 5.9 and homes sold at 97% of list price on average, so buyers had choice and some room on price.
The 131 condo apartments that sold had a median price of $537,000 and an average of $608,022, and took 42 days to sell on average. There were 780 condo apartments for sale at month end, which is a lot of choice for a single district.
What it means for buyers and sellers
For first-time buyers, a condo apartment benchmark under $500,000 in a central district is notable. For investors, compare the purchase price with current rents and carrying costs before assuming a lower price means a better return.
The five at a glance
| District | Benchmark, Sep 2026 | Change vs Sep 2025 | Homes sold, Sep 2026 | Months of inventory |
|---|---|---|---|---|
| E11 Malvern, Rouge | $653,600 | −9.54% | 28 | 5.0 |
| E04 Wexford-Maryvale, Dorset Park and area | $706,800 | −8.81% | 52 | 3.7 |
| E08 Scarborough Village, Cliffcrest, Guildwood | $782,900 | −8.10% | 36 | 5.4 |
| E09 Bendale, Woburn, Morningside | $697,500 | −7.70% | 47 | 4.6 |
| C08 Church-Yonge, Moss Park, Cabbagetown and area | $546,800 | −7.49% | 146 | 5.9 |
Source: TRREB Market Watch, September 2026 (MLS® HPI composite benchmark). Sales and months of inventory as published on my district pages from the same TRREB report.
What this means if you’re buying or selling in Toronto
A falling benchmark tells you the district as a whole has repriced; it does not tell you what any single home is worth. Four of the five are Scarborough districts where detached homes were the largest group of September sales, while condo apartments made up 131 of C08’s 146 sales. Before you act, compare the last three to six months of sales for your home type on your street or in your building.
The other thing to watch is how the drop splits by home type. In E08 and E04 the detached benchmark fell close to 10%, while in E09 townhouses rose. A house owner in E09 and a condo owner in C08 are not in the same market, even if both districts appear on this list.
If you are buying, check how close homes are selling to list price and how long they sit. In September 2026, TRREB reported the GTA-wide average price at $1,006,409, down 5.1% year over year, so negotiating room is not limited to these five districts.
If you are selling, price against current sales, not last year’s. I am not predicting where prices go next; these figures describe what has already happened. If you want the street-level numbers behind a district average, my home valuation page is the place to start.
Free tool — AI home value estimator
Instant Home Valuation
What’s your home
worth today?
Answer six quick questions and get an instant value range built from current Toronto & GTA sale data — property type, size, condition, lot and location all weighted the way a real pricing conversation weighs them. Takes about ninety seconds.
Reading recent GTA sale data…
Building your estimate
Estimated market value
—
$0–$0
Most likely value $0 · roughly $0 per square foot
What moved the number
Starting from the area baseline for your property type, here’s what each answer added or subtracted.
Market context
Recent local averages for comparison.
—
A range is a starting point.
A strategy is what sells.
This model doesn’t know that your neighbour’s identical semi went $80,000 over asking last month, or which two upgrades actually pay back in your area. That conversation is free and takes twenty minutes.
Frequently asked questions
Are Toronto home prices going down in 2026?
Year over year, yes. TRREB’s September 2026 Market Watch shows the GTA MLS® HPI composite benchmark down 4.7% from September 2025 and the average selling price down 5.1% to $1,006,409. The City of Toronto composite benchmark was down 3.84%. These figures describe the past twelve months, not a forecast.
Which Toronto district had the biggest price drop in 2026?
Among districts with a complete benchmark, E11 (Malvern and the Rouge) fell most, down 9.54% to $653,600 in September 2026 vs September 2025. TRREB’s table shows C06 down 11.27%, but its benchmark has no townhouse component and only 19 homes sold, so I did not rank it.
Did any Toronto districts see prices go up?
A few. In TRREB’s September 2026 report, the W06 benchmark (Mimico, New Toronto, Long Branch and Alderwood) rose 1.24% year over year and W08 rose 0.12%. W07 showed +2.45%, but its benchmark has no townhouse component, so treat that figure with care.
Why use the benchmark price instead of the average price?
The MLS® HPI benchmark tracks a typical home and adjusts for the mix of homes sold. A district’s average or median can swing just because more condos or more detached houses sold in a given month, which can look like a price change when it is not.
Does a falling district benchmark mean my home lost the same amount?
Not necessarily. A TRREB district benchmark is an average across many neighbourhoods and home types. In E09, for example, the overall benchmark fell 7.70% while the townhouse benchmark rose 3.66%. Recent sales of similar homes near you are the better guide.
Sources
- Market Watch, September 2026 — Toronto Regional Real Estate Board
- This Month in the GTA Housing Market: September 2026 — Jatin Dua
- Toronto E11 Real Estate Market: September 2026 — Jatin Dua
- Toronto E04 Real Estate Market: September 2026 — Jatin Dua
- Toronto E08 Real Estate Market: September 2026 — Jatin Dua
- Toronto E09 Real Estate Market: September 2026 — Jatin Dua
- Toronto C08 Real Estate Market: September 2026 — Jatin Dua
- Toronto C06 Real Estate Market: September 2026 — Jatin Dua
Related reading
- Top 5 GTA Areas Where Home Prices Held Up Best in 2026
- Top 5 Toronto Areas Where Condo Rents Fell Most in 2026
- Top 5 GTA Areas for Rental Yield in 2026
- GTA market data by district
About the author — Jatin Dua, Toronto and GTA real estate broker
I am Jatin Dua, Broker of Record and co-founder of RE/MAX Quantum Realty Inc., Brokerage, Unit 101, 799 The Queensway, Toronto. I work with buyers and sellers across Toronto and the GTA and have helped more than 100 families sell. Four-plus years of active GTA transactions and over $100 million in sales volume. Every figure here comes from a published table, regulator or statute linked in the sources, so you can check all of it without asking me.
Reach me at [email protected] or 833-330-1925, or book a call.