

Published 10 August 2026 · Updated 7 September 2026 · By Jatin Dua, Broker of Record, RE/MAX Quantum Realty
What's Your Home Worth Right Now?
Get a free AI-powered price range for your property in under 90 seconds, based on recent GTA comparable sales. No name or address required.
Get My Free Estimate →Yes, on the reported data — with one line worth watching. In 2025 Stonegate-Queensway recorded 12 robberies, 137 assaults, 57 auto thefts and 64 break-and-enters among 29,422 residents. Its assault rate (466 per 100,000), robbery rate (41), auto theft rate (194) and theft-from-vehicle rate (129) were all below the Toronto averages of 768, 78, 225 and 212.
It ranked 104th of Toronto’s 158 neighbourhoods on the five combined indicators, where 158 is the lowest. The line worth watching: recorded shootings went from zero in 2021 and 2022 and one in 2023, to four in 2024 and four in 2025.
The 2025 numbers
| 2025, per 100,000 residents | Stonegate-Queensway | Toronto | Count |
|---|---|---|---|
| Assault | 466 | 768 | 137 |
| Break and enter | 218 | 190 | 64 |
| Robbery | 41 | 78 | 12 |
| Auto theft | 194 | 225 | 57 |
| Theft from a motor vehicle | 129 | 212 | 38 |
| Theft over $5,000 | 68 | 61 | 20 |
Four of six below the Toronto average, two modestly above. The robbery rate is roughly half the city’s.
The property-crime trend is strongly downward
This is the genuinely good news, and it is a big movement rather than a rounding change.
| Counts | 2019 | 2023 | 2024 | 2025 |
|---|---|---|---|---|
| Auto theft | 35 | 152 | 83 | 57 |
| Break and enter | 64 | 101 | 89 | 64 |
| Theft from a motor vehicle | 73 | 69 | 47 | 38 |
| Assault | 84 | 138 | 139 | 137 |
| Robbery | 24 | 18 | 10 | 12 |
Auto theft has fallen by 62% from its 2023 peak. Break-and-enters are back to their 2019 level after a spike. Thefts from vehicles are down by nearly half since 2019. Assault rose after 2019 and has been flat for three years. Toronto as a whole followed the same auto-theft curve — 12,418 in 2023, 9,551 in 2024, 7,240 in 2025 — so this is a city-wide improvement showing up locally, not a Stonegate-specific miracle.
The line I am not going to bury: shootings
The dataset also records four homicides in Stonegate-Queensway across the five years 2021 to 2025 — one in 2021, two in 2023 and one in 2025.
Four shooting occurrences in a neighbourhood of 29,422 people is a small number in absolute terms, and two consecutive years at that level after three quiet years is still a short series. But it is an increase, it is the only indicator here moving the wrong way, and pretending otherwise would make everything else on this page worth less. If you are buying here, it is a fair thing to raise with 22 Division at a community meeting and to ask neighbours about directly.
Thinking about buying or selling here?
I work this area every week and I will give you a straight answer, including when the answer is to wait. No pressure, and no drip campaign you cannot get out of.
Call or text 833-330-1925 Send me a message
Jatin Dua, Broker of Record — RE/MAX Quantum Realty Inc., Brokerage. Not intended to solicit buyers or sellers currently under contract with another brokerage.
Where things happen
Across the 285 major-crime records with a 2025 occurrence date in Stonegate-Queensway:
| Premises type | Count |
|---|---|
| House | 88 |
| Outside | 78 |
| Apartment | 53 |
| Commercial | 52 |
| Other, transit and educational | 14 |
The break-and-enter picture is the one buyers ask about most, and it is specific: of the 63 break-and-enter records with a 2025 occurrence date, 36 were at a single home or house, 10 at an apartment and 9 at commercial premises. This is a residential break-in pattern, not a commercial one — which is consistent with a neighbourhood of detached houses on quiet crescents backing onto ravine and park land.
The practical reading
Stonegate-Queensway’s above-average number is break-and-enter, and the incidents are concentrated in detached houses. Rear access, ravine backing, side gates, poor sightlines from the street and long unoccupied stretches during the workday are the relevant variables — all of which you can assess on a viewing, and all of which are more useful to you than the neighbourhood rate.
What the data leaves out
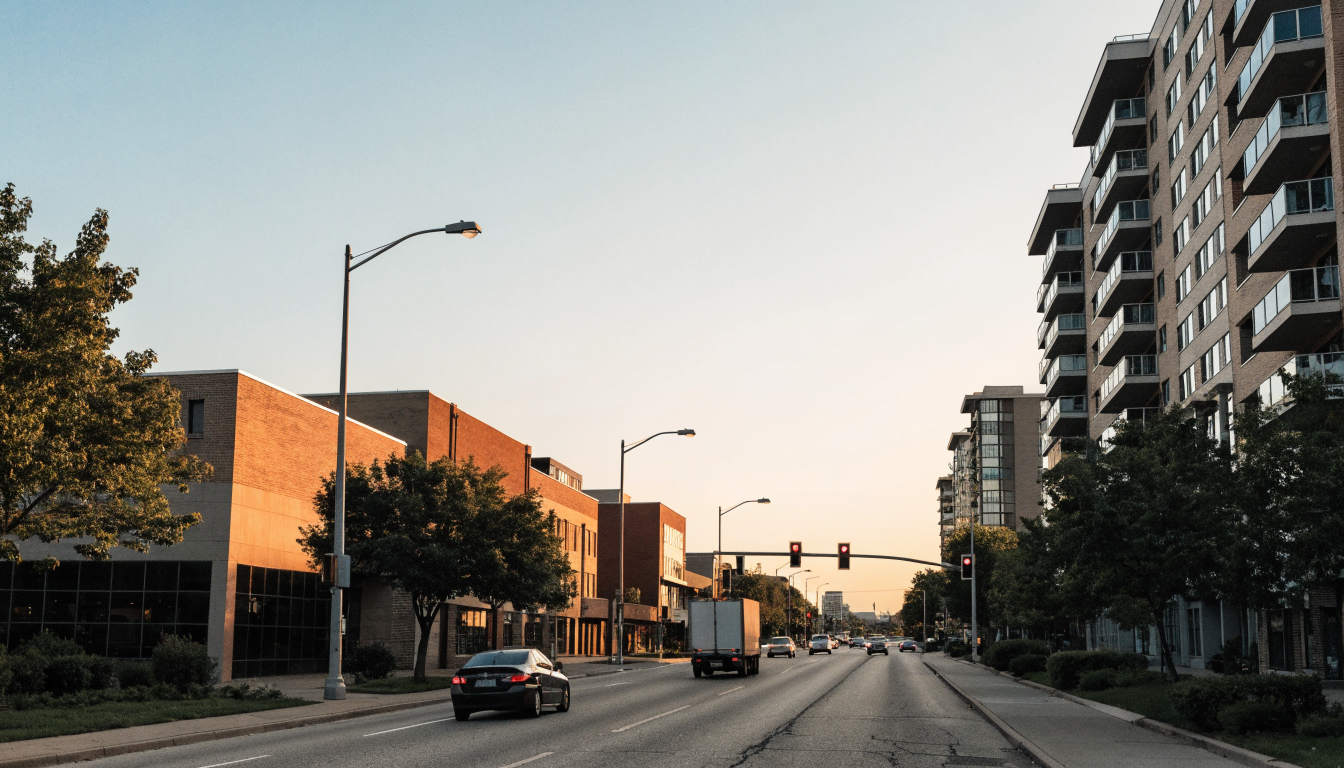
- This is two neighbourhoods in one boundary. The Stonegate side is quiet detached streets around Berry Road and Park Lawn, with ravine and park frontage. The Queensway side is a wide commercial arterial with retail, car dealerships and a growing run of new condo towers. They read completely differently at night, and the neighbourhood-level rate averages them together.
- The Queensway itself is the traffic question. It is a fast, wide arterial with long blocks. If you are buying with young children or you intend to walk everywhere, the distance to a signalised crossing matters more to daily life than anything in the crime table. The City’s Vision Zero dashboard maps road-safety data.
- Condo garages, again. Fifty-seven auto thefts across the year in a neighbourhood adding towers steadily is below the city rate, but if you are buying in a building, ask management about garage access control, fob auditing and incident history, and read the status certificate. Building-level variation dwarfs neighbourhood-level variation.
- The Mimico Creek corridor. Development near the creek is regulated by the Toronto and Region Conservation Authority, and basement water is a legitimate due-diligence question on the lower streets. Check the property against TRCA mapping and ask about backwater valves.
Weighing a specific Stonegate or Queensway address?
Send me the address or the intersection. I work out of 799 The Queensway, so this is my immediate patch — I will tell you what I know about that block, including the parts that never make it into a dataset, and what it means for value and resale.
connect@jatindua.com · 833-330-1925 · Book a free consultation
Confidential. Reviewed personally and answered within 24 hours. I never share, sell or distribute your information.
Frequently asked questions
Is Stonegate-Queensway safe?
On the 2025 Toronto Police data, yes. Its assault rate (466 per 100,000), robbery rate (41), auto theft rate (194) and theft-from-vehicle rate (129) were all below the Toronto averages of 768, 78, 225 and 212. Break-and-enter at 218 and theft over $5,000 at 68 were modestly above the city’s 190 and 61. It ranked 104th of Toronto’s 158 neighbourhoods on the five combined indicators, where 158 is the lowest.
Is The Queensway area of Etobicoke safe at night?
Twelve robberies were recorded across the whole neighbourhood in 2025, about half the city’s per-capita rate. The Queensway is a wide, well-lit commercial arterial that is busy with traffic but quiet with pedestrians after the shops close; the residential side streets north and south of it feel very different. Walk your own route between the bus stop and your front door after dark before you commit.
Are break-ins common in Stonegate-Queensway?
The break-and-enter rate of 218 per 100,000 is above Toronto’s 190, and 36 of the 63 break-and-enter records with a 2025 occurrence date were at a single home or house. The count has fallen from 101 in 2023 to 89 in 2024 to 64 in 2025, back to its 2019 level. Rear access, ravine backing and street sightlines are the practical variables to assess on a viewing.
Have there been shootings in Stonegate-Queensway?
Toronto Police’s neighbourhood dataset records no shootings in 2021 or 2022, one in 2023, four in 2024 and four in 2025, along with four homicides across the five years 2021 to 2025. Those are small absolute numbers in a neighbourhood of 29,422 people, but the two-year increase is real and it is the only indicator here moving in the wrong direction.
Is car theft a problem on The Queensway?
Less than it was. Auto theft in Stonegate-Queensway fell from 152 in 2023 to 83 in 2024 to 57 in 2025, a 62% drop from the peak, and the 2025 rate of 194 per 100,000 is below Toronto’s 225. Toronto-wide auto theft fell from 12,418 to 7,240 over the same period.
Where can I check Stonegate-Queensway crime statistics myself?
The Toronto Police Service Public Safety Data Portal at data.torontopolice.on.ca. Stonegate-Queensway is one of the City of Toronto’s 158 named neighbourhoods, so you can filter both the Neighbourhood Crime Rates and Major Crime Indicators datasets directly to it, free of charge.
Sources
- Toronto Police Service — Neighbourhood Crime Rates (Open Data), 2019 and 2023 to 2025 figures for Stonegate-Queensway and all 158 neighbourhoods, accessed 9 August 2026.
- Toronto Police Service — Major Crime Indicators (Open Data), occurrence-level records with location and premises type.
- Toronto Police Service Public Safety Data Portal.
- City of Toronto — Vision Zero road safety dashboard.
- Toronto and Region Conservation Authority — regulated areas and floodplain mapping.
Thinking about buying or selling here?
I work this area every week and I will give you a straight answer, including when the answer is to wait. No pressure, and no drip campaign you cannot get out of.
Call or text 833-330-1925 Send me a message
Jatin Dua, Broker of Record — RE/MAX Quantum Realty Inc., Brokerage. Not intended to solicit buyers or sellers currently under contract with another brokerage.
Read next
- Is Etobicoke safe? The full neighbourhood data · Is Mimico safe? · Is Humber Bay Shores safe?
- M8Y and M8Z real estate guide: Stonegate-Queensway and the Queensway corridor
- Why buy a condo on The Queensway · Queensway vs Humber Bay Shores
- Condo maintenance fees in Etobicoke · Status certificates explained
Looking at Etobicoke more broadly? Start with my Etobicoke community guide — the neighbourhoods, what each pocket is like, and where they sit relative to one another.
About the author — Jatin Dua, Etobicoke real estate agent
I am Jatin Dua, a Realtor with RE/MAX Quantum Realty. My office is at 799 The Queensway, inside this neighbourhood, so it is the market I know street by street. I will tell you plainly when a block or a building is the weaker option.