

Published 10 August 2026 · Updated 7 September 2026 · By Jatin Dua, Broker of Record, RE/MAX Quantum Realty
What's Your Home Worth Right Now?
Get a free AI-powered price range for your property in under 90 seconds, based on recent GTA comparable sales. No name or address required.
Get My Free Estimate →Yes — with two caveats I am not going to hide. Alderwood’s 2025 rates for assault (508 per 100,000), robbery (70), auto theft (223) and theft from vehicles (132) all sit below the Toronto averages of 768, 78, 225 and 212. It ranked 80th of Toronto’s 158 neighbourhoods on the five combined indicators.
The caveats: assaults have roughly doubled since 2019, from 36 to 73, and Alderwood’s theft-over-$5,000 rate was the 12th highest in Toronto — driven mostly by its employment lands, not its houses. Detail below.
The 2025 numbers
| 2025, per 100,000 residents | Alderwood | Toronto | Count |
|---|---|---|---|
| Assault | 508 | 768 | 73 |
| Break and enter | 202 | 190 | 29 |
| Robbery | 70 | 78 | 10 |
| Auto theft | 223 | 225 | 32 |
| Theft from a motor vehicle | 132 | 212 | 19 |
| Theft over $5,000 | 104 | 61 | 15 |
The two lines that stand out
1. Theft over $5,000 — and why it is not about your house
Alderwood’s theft-over rate of 104 per 100,000 was the 12th highest of Toronto’s 158 neighbourhoods. That sounds alarming for a bungalow neighbourhood until you look at where the incidents were recorded. In the occurrence-level Major Crime Indicators dataset, of the 14 theft-over records with a 2025 occurrence date in Alderwood:
- 7 at other commercial or corporate premises — warehouses and corporate buildings
- 2 in parking lots
- 2 at a single home or house
- 1 each at an apartment, a short-term rental unit and a construction site
Half of them happened in the Evans and Horner employment lands that sit inside the Alderwood boundary, not on a residential street. That is exactly the kind of distortion a per-resident rate creates: a small residential population divided into occurrences generated by an industrial area produces a scary-looking number that describes something else entirely.
2. Assaults have doubled since 2019
| Counts | 2019 | 2023 | 2024 | 2025 |
|---|---|---|---|---|
| Assault | 36 | 44 | 50 | 73 |
| Break and enter | 26 | 20 | 32 | 29 |
| Robbery | 5 | 8 | 1 | 10 |
| Auto theft | 16 | 51 | 51 | 32 |
| Theft from a motor vehicle | 54 | 16 | 20 | 19 |
That is a real increase and I am not going to explain it away. Two things are worth putting alongside it. First, Toronto’s assault count rose over the same period too, so Alderwood is not diverging from the city — it is still well below the city rate. Second, the location data matters: of the 61 assault records with a 2025 occurrence date in Alderwood, 26 were at a single home or house and 12 in an apartment. Nine were on a street or road.
That pattern holds city-wide. Across Toronto in 2025, dwellings accounted for roughly 41% of assault records and streets and roads for about 17%. An assault rate is a poor proxy for how safe a sidewalk feels, because most assaults do not happen on sidewalks.
Thinking about buying or selling here?
I work this area every week and I will give you a straight answer, including when the answer is to wait. No pressure, and no drip campaign you cannot get out of.
Call or text 833-330-1925 Send me a message
Jatin Dua, Broker of Record — RE/MAX Quantum Realty Inc., Brokerage. Not intended to solicit buyers or sellers currently under contract with another brokerage.
The serious incidents
Toronto Police’s neighbourhood dataset records five homicides in Alderwood across the five years 2021 to 2025 — three in 2022, two in 2024, and none in 2021, 2023 or 2025. It records two shootings across the same five years, one in 2022 and one in 2025.
Five homicides in five years in a neighbourhood of 14,000 people is more than you would expect from Alderwood’s otherwise quiet profile, and it deserves to be stated plainly rather than averaged away. It is also, in a five-year window, a very small number of events, three of which fell in a single year. It tells you almost nothing predictive about 2027.
Where things happen in Alderwood
Across all 143 major-crime records with a 2025 occurrence date:
| Premises type | Count |
|---|---|
| House | 49 |
| Commercial | 37 |
| Outside | 36 |
| Apartment | 15 |
| Other, transit and educational | 6 |
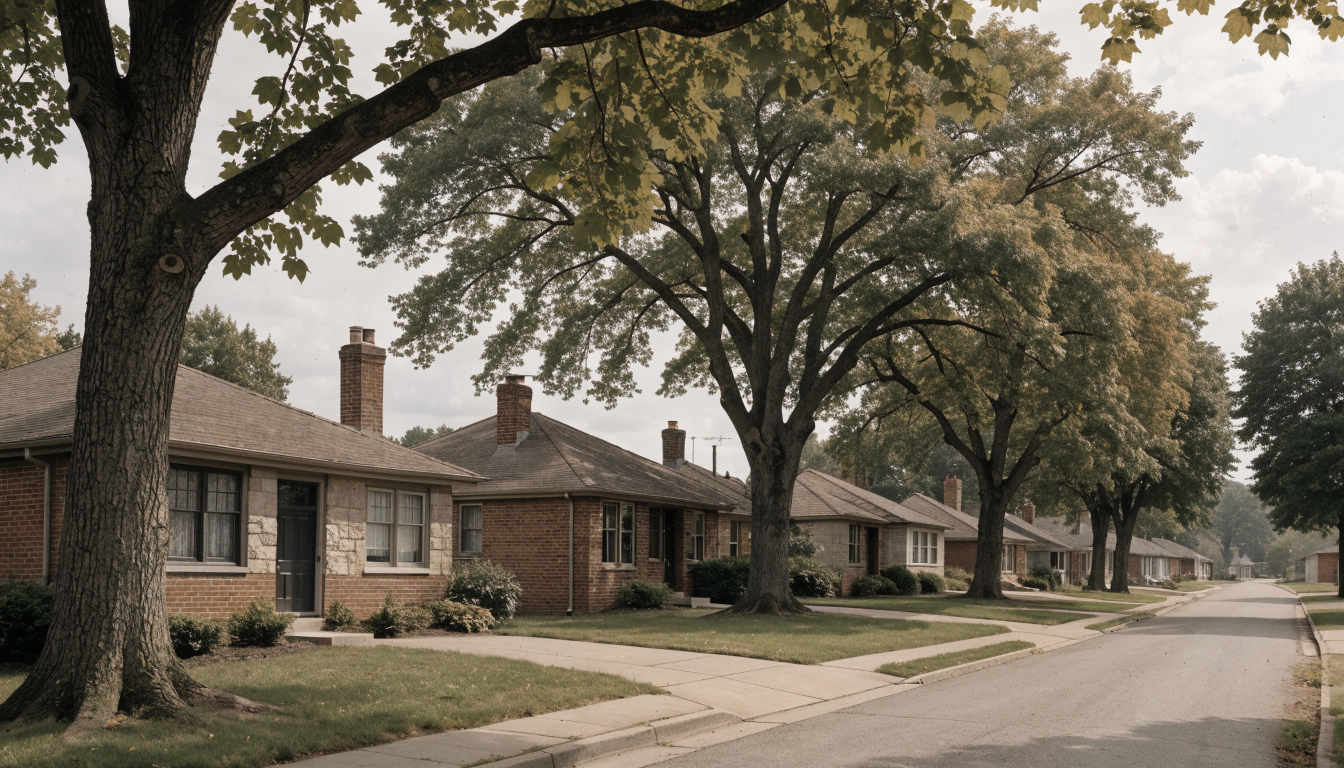
Alderwood is a low-rise, owner-occupied, detached-and-side-split neighbourhood with an industrial edge, and the data reflects exactly that shape.
What the numbers do not cover
- Transit access is the trade-off, not safety. Alderwood has no GO station and no subway. Getting downtown means a bus to Long Branch GO or Kipling Station. That is the neighbourhood’s real daily friction, and it is the reason it is cheaper than Long Branch next door.
- Brown’s Line and Horner Avenue are wide arterials. If you have children who will walk to school, the distance to a signalised crossing is worth checking on a map before you look at a house. The City’s Vision Zero dashboard maps road-safety data.
- Etobicoke Creek runs the western boundary. Development near it is regulated by the Toronto and Region Conservation Authority, and basement water is a legitimate due-diligence question on lower-lying streets. Ask about backwater valves and past flooding, and check the property against TRCA’s regulated-area mapping.
- Alderwood’s housing stock is mostly 1950s and 1960s. Wiring, plumbing and drainage of that vintage carry their own risks — a different kind of safety, and one an inspection will find.
Considering a specific Alderwood street?
Send me the address or the intersection. I will tell you honestly what I know about that block — proximity to the creek and the industrial edge, the walk to the bus, and what it means for resale — and whether Long Branch or Etobicoke’s other pockets would serve you better for the same money.
connect@jatindua.com · 833-330-1925 · Book a free consultation
Confidential. Reviewed personally and answered within 24 hours. I never share, sell or distribute your information.
Frequently asked questions
Is Alderwood Toronto safe?
On the 2025 Toronto Police data, yes. Alderwood’s rates for assault (508 per 100,000), robbery (70), auto theft (223) and theft from vehicles (132) were all below the Toronto averages of 768, 78, 225 and 212. Its break-and-enter rate of 202 was slightly above the city’s 190. It ranked 80th of Toronto’s 158 neighbourhoods on the five combined indicators, where 158 is the lowest.
Why is Alderwood’s theft rate high?
Because the neighbourhood boundary includes the Evans and Horner employment lands. Of the 14 theft-over-$5,000 records with a 2025 occurrence date in Alderwood, seven were at commercial or corporate premises such as warehouses and one at a construction site. Only two were at a single home. The rate is calculated against 14,367 residents, which makes a small number of industrial thefts look large.
Is crime increasing in Alderwood?
Assaults are: 36 in 2019, 44 in 2023, 50 in 2024 and 73 in 2025. That is a real rise, though Alderwood’s assault rate is still well below the Toronto average and Toronto’s assault count rose over the same period too. Auto theft peaked at 51 in 2023 and 2024 and fell to 32 in 2025, and theft from vehicles has fallen sharply since 2019.
Have there been homicides in Alderwood?
Toronto Police’s neighbourhood dataset records five homicides in Alderwood across the five years 2021 to 2025 — three in 2022, two in 2024, and none in 2021, 2023 or 2025 — along with two shootings, one in 2022 and one in 2025. Those are small absolute numbers concentrated in two years, but I would rather report them than round them away.
Is Alderwood or Long Branch safer?
Long Branch is marginally quieter on the 2025 data, ranking 103rd of 158 against Alderwood’s 80th, with lower break-and-enter, auto theft, robbery and theft-over rates. Alderwood had the lower assault rate of the two, 508 against Long Branch’s 578. Both sit comfortably in the quieter half of Toronto and the gap between them is too small to drive a buying decision on its own.
Is Alderwood a good neighbourhood for families?
It is one of the more family-oriented pockets in south Etobicoke — low-rise, owner-occupied, generous lots, and Etobicoke Valley Park and the creek trail on the doorstep. The honest trade-off is transit: no GO station and no subway, so a downtown commute means a bus connection. That, rather than safety, is what usually decides it.
Sources
- Toronto Police Service — Neighbourhood Crime Rates (Open Data), 2019 and 2023 to 2025 figures for Alderwood and all 158 neighbourhoods, accessed 9 August 2026.
- Toronto Police Service — Major Crime Indicators (Open Data), occurrence-level records with location and premises type.
- Toronto Police Service Public Safety Data Portal.
- City of Toronto — Vision Zero road safety dashboard.
- Toronto and Region Conservation Authority — regulated areas and floodplain mapping.
Thinking about buying or selling here?
I work this area every week and I will give you a straight answer, including when the answer is to wait. No pressure, and no drip campaign you cannot get out of.
Call or text 833-330-1925 Send me a message
Jatin Dua, Broker of Record — RE/MAX Quantum Realty Inc., Brokerage. Not intended to solicit buyers or sellers currently under contract with another brokerage.
Read next
- Is Etobicoke safe? The full neighbourhood data · Is Long Branch safe?
- Long Branch vs Alderwood: which is the better buy?
- M8W real estate guide: Alderwood and Long Branch
- The 1950s and 1960s Etobicoke bungalow inspection checklist · Etobicoke commute guide
Looking at Etobicoke more broadly? Start with my Etobicoke community guide — the neighbourhoods, what each pocket is like, and where they sit relative to one another.
About the author — Jatin Dua, Etobicoke real estate agent
I am Jatin Dua, a Realtor with RE/MAX Quantum Realty, working from 799 The Queensway. Alderwood, Long Branch, New Toronto and Mimico are the neighbourhoods I cover most closely, and I will tell you when the one you like is the wrong fit.