

Published 29 September 2026 · By Jatin Dua, Broker of Record, RE/MAX Quantum Realty
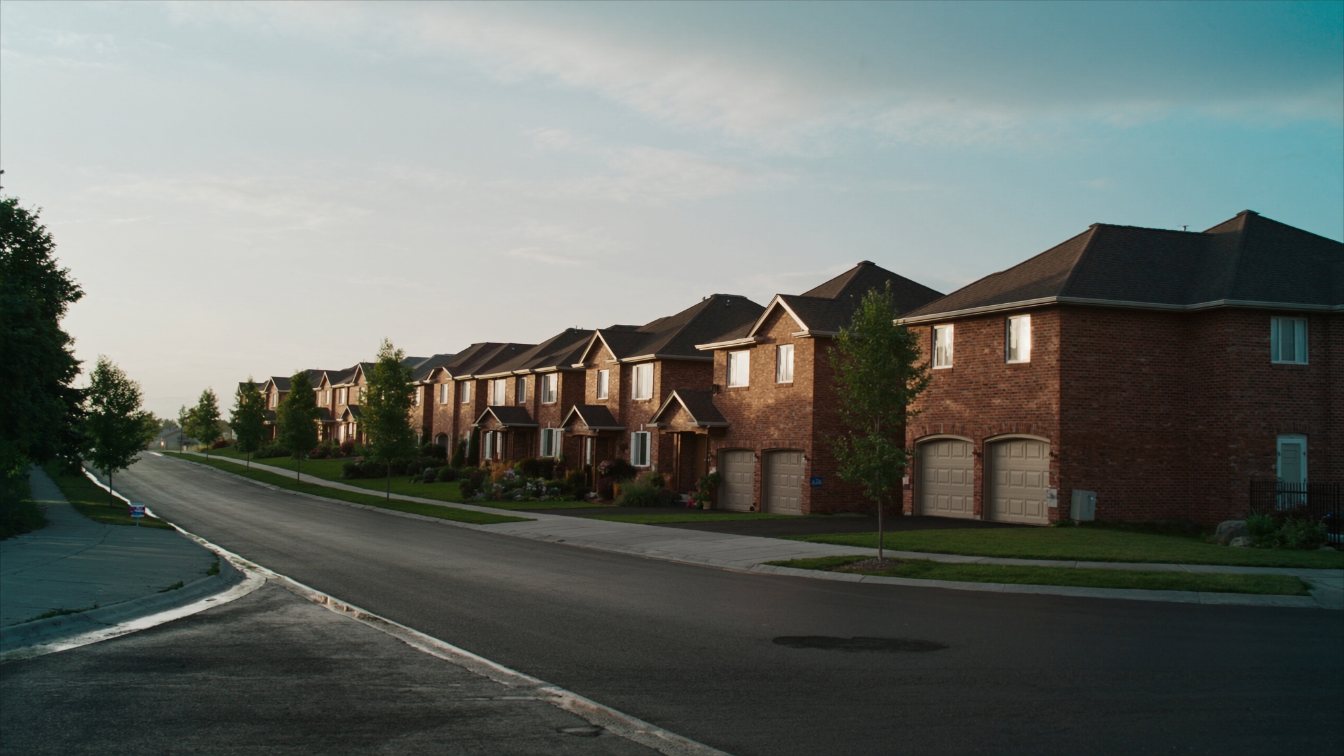
In August 2026 TRREB recorded 164 detached house sales in Mississauga at a median of $1,189,000 and an average of $1,275,221, selling at 97 percent of list price in 33 days on average. Semi-detached houses sold at a median of $881,000 on 66 sales, and freehold townhouses at $855,000 on only 11 sales. TRREB’s detached HPI benchmark, its model price for a typical house, was $1,252,700, down 5.70 percent from August 2025, so yes, prices were lower than a year earlier. There were about 5.2 months of detached inventory and roughly 42 percent of new listings sold (my arithmetic): balanced, with buyers able to compare. Mississauga has no municipal land transfer tax, so a buyer of the median detached house pays $20,255 in Ontario tax, half what the same purchase costs in Toronto.
Mississauga house prices, August 2026
| August 2026 | Mississauga | Peel Region | City of Toronto | All TRREB |
|---|---|---|---|---|
| Detached sales | 164 | 473 | 550 | 2,399 |
| Detached median | $1,189,000 | $1,050,000 | $1,170,000 | $1,100,000 |
| Detached average | $1,275,221 | $1,131,887 | $1,525,749 | $1,288,669 |
| Detached sale to list | 97% | 96% | 97% | 97% |
| Detached days on market | 33 | 35 | 30 | 33 |
| Semi-detached sales | 66 | 148 | 159 | 439 |
| Semi median | $881,000 | $825,000 | $981,000 | $866,000 |
| Semi average | $879,494 | $821,799 | $1,110,639 | $931,665 |
| Semi sale to list | 98% | 98% | 100% | 99% |
| Semi days on market | 27 | 28 | 27 | 28 |
| Freehold townhouse sales | 11 | 73 | 45 | 437 |
| Townhouse median | $855,000 | $760,000 | $962,000 | $840,000 |
| Townhouse average | $874,772 | $758,739 | $1,026,018 | $882,060 |
| Townhouse sale to list | 99% | 98% | 98% | 98% |
| Townhouse days on market | 26 | 31 | 28 | 31 |
Source: TRREB Market Watch, August 2026. One month of data. Mississauga’s 11 freehold townhouse sales are a small sample and can swing a lot month to month. The townhouse rows cover freehold houses only; Mississauga’s many condominium townhouses are reported in a separate TRREB table and are not included here.
Mississauga’s detached median was $139,000 above Peel’s and $19,000 above the City of Toronto’s (my arithmetic). Its average, though, was well below Toronto’s, because Toronto’s top end is far larger. The gap between Mississauga’s average and median was $86,221, which tells you some large lakeshore and estate-lot houses closed alongside ordinary suburban ones.
How TRREB reports Mississauga
TRREB splits Toronto into lettered districts, but not Peel. The Market Watch gives one Mississauga row, which blends very different markets:
- South Mississauga along the lake. Port Credit, Mineola, Lorne Park and Clarkson, with older houses on larger lots, mature trees and the Lakeshore West GO line. The top of the market.
- Central Mississauga. Cooksville, Applewood, Erindale and the streets around the city centre, much of it 1960s to 1980s housing on good lots, now attracting rebuilds.
- West and northwest. Erin Mills, Churchill Meadows, Meadowvale, Lisgar and Streetsville, mostly newer subdivisions with semis and freehold townhouses alongside detached houses.
- Northeast. Malton and the areas near Pearson, generally the lower-priced end of the city’s detached market.
So the $1,189,000 median is a blend of lakeshore houses that can sell for several times that and northeast houses that sell below it. Your sub-area matters more than the city figure.
Are Mississauga house prices going down? The HPI benchmark
The MLS® Home Price Index benchmark is TRREB’s model price for a typical home with fixed features. It is not a sale, but because it holds the house constant it shows direction better than a monthly median.
| HPI benchmark, August 2026 | Mississauga | Change vs Aug 2025 | Peel Region | Change vs Aug 2025 |
|---|---|---|---|---|
| Detached | $1,252,700 | −5.70% | $1,117,000 | −6.17% |
| Attached (semi) | $872,700 | −5.85% | $805,400 | −5.77% |
| Townhouse | $692,800 | −7.17% | $668,200 | −6.66% |
| All home types (composite) | $874,400 | −4.65% | $871,200 | −5.23% |
Source: TRREB Market Watch, August 2026, MLS® HPI. The townhouse benchmark is TRREB’s own category and does not line up exactly with the freehold townhouse sales table above.
A typical Mississauga detached house was modelled about 5.7 percent lower than a year earlier, a little less of a drop than Peel as a whole and more than the City of Toronto’s 4.33 percent. Note that August’s actual detached median, $1,189,000, sat $63,700 below the benchmark (my arithmetic). That is normal: the median depends on which houses happened to sell that month. For a broader view on direction, see will Toronto house prices drop in 2027.
What the numbers mean for your list price
Mississauga had 850 detached houses for sale against 164 sales, about 5.2 months of inventory, and 386 new listings, a sales-to-new-listings ratio of about 42 percent (my arithmetic). Across all TRREB areas the figures were 4.7 months and 43 percent. That is a balanced-to-soft market for detached houses.
Semis were firmer: 203 active against 66 sales is about 3.1 months, and about 49 percent of new semi listings sold. Freehold townhouses looked softer, at about 6.1 months and 28 percent, but on 11 sales I would not read much into that.
Detached houses sold at 97 percent of list price on average. That counts only houses that sold, against their final list price, which was often a reduced one. With five months of supply, buyers compare, so a house priced from recent comparable sales sells near asking and an overpriced one sits and then chases the market down. The planning assumption for days on market is about a month, not a week. If you need speed, read how to sell your home fast; the same principles apply in Mississauga.
What moves your house above or below the Mississauga median
- Lot frontage and depth. In Lorne Park, Mineola and parts of Clarkson and Applewood, the lot drives the price and many buyers are buying land to rebuild. A wide, deep lot on a quiet street is worth far more than the house on it suggests.
- Detached, semi or townhouse. In August the detached median was $308,000 above the semi median (my arithmetic). A linked house, one joined only below grade, sits between the two in buyers’ minds.
- Basement and second unit. A finished basement with a separate entrance appeals to buyers who want space for family or rental income. Whether any second unit meets the building and fire code and was permitted matters; buyers’ lawyers and lenders ask.
- Garage and parking. A double garage and a driveway that fits four cars is standard in newer subdivisions and expected by buyers there.
- Renovation level. A 1970s back-split with its original kitchen competes with a renovated one on the same street. Price against the same tier.
- Sub-area and street. Lakeshore proximity, a crescent versus a main road, and backing onto a park or ravine all move the price. So does aircraft noise in parts of the northeast near Pearson.
- Schools. Buyers check school catchments early. Confirm your address’s schools with the school board.
- Transit and highways. Walking distance to a GO station on the Lakeshore West line (Port Credit, Clarkson) or the Milton line (Cooksville, Erindale, Streetsville, Meadowvale), and quick access to the 401, 403 or QEW, widen the buyer pool. The Hurontario LRT corridor is a factor for houses near Hurontario Street.
- Age and big systems. Roof, windows, furnace and air conditioning, the electrical panel and plumbing. Much of central Mississauga was built 40 to 60 years ago, and buyers budget for those systems.
The land transfer tax point
Mississauga has no municipal land transfer tax; Toronto does. At Mississauga’s $1,189,000 detached median, a buyer pays $20,255 in Ontario land transfer tax. The same price in Toronto adds another $20,255 to the City, $40,510 in total (my arithmetic from the published brackets, before first-time buyer refunds of up to $4,000 provincially and $4,475 in Toronto). At the $881,000 semi median, the Ontario tax is $14,095.
That $20,255 saving is real money to a buyer weighing a Mississauga house against one in Etobicoke or the West End. Put it in your marketing if your buyer pool includes Toronto families. Check any figure with the land transfer tax calculator.
How to get an accurate number for your house
The city median is a starting line, not your price. Your MPAC assessment is not a guide either: 2026 property taxes are still based on 1 January 2016 values.
Two tools help here: the AI home value estimator below gives you a range for your house in about a minute, and the net proceeds calculator turns any price into what actually lands in your account.
Then get a broker price opinion: a comparative market analysis built from recent sales of houses like yours in your part of the city, adjusted for lot, basement, garage, renovation level and condition, and checked against what is for sale now. For more local figures, see Mississauga home values.
If you are comparing nearby markets, see what houses are worth in Brampton, Oakville and Milton, or what Mississauga condos are worth if you are downsizing.
Where I fit
I sell houses across Mississauga, Peel, Halton and Toronto, and I price them from the sales a buyer will actually compare yours with, not the city average. When you have your estimator range, book a call or phone 833-330-1925.
Free tool — AI home value estimator
Instant Home Valuation
What’s your home
worth today?
Answer six quick questions and get an instant value range built from current Toronto & GTA sale data — property type, size, condition, lot and location all weighted the way a real pricing conversation weighs them. Takes about ninety seconds.
Reading recent GTA sale data…
Building your estimate
Estimated market value
—
$0–$0
Most likely value $0 · roughly $0 per square foot
What moved the number
Starting from the area baseline for your property type, here’s what each answer added or subtracted.
Market context
Recent local averages for comparison.
—
A range is a starting point.
A strategy is what sells.
This model doesn’t know that your neighbour’s identical semi went $80,000 over asking last month, or which two upgrades actually pay back in your area. That conversation is free and takes twenty minutes.
Frequently asked questions
How much is a detached house worth in Mississauga in 2026?
In August 2026 TRREB recorded 164 detached sales in Mississauga at a median of $1,189,000 and an average of $1,275,221. TRREB’s HPI benchmark for a typical detached house was $1,252,700. Lakeshore and large-lot houses in Lorne Park, Mineola and Port Credit sell well above those figures; recent sales near you give the real answer.
Are house prices going down in Mississauga?
Compared with a year earlier, yes. TRREB’s detached HPI benchmark for Mississauga was $1,252,700 in August 2026, down 5.70 percent from August 2025. The semi benchmark fell 5.85 percent and the composite for all home types fell 4.65 percent. One month of sales on its own cannot tell you where prices go next.
What is the average price of a semi-detached house in Mississauga?
In August 2026, 66 semi-detached houses sold in Mississauga at an average of $879,494 and a median of $881,000, at 98 percent of list price in 27 days on average. Semis were the firmest part of the market, with about 3.1 months of inventory (my arithmetic).
How long does it take to sell a house in Mississauga?
In August 2026 detached houses in Mississauga averaged 33 days on market, semis 27 days and freehold townhouses 26 days. Those averages include only the houses that sold. With about five months of detached inventory, an overpriced house can sit much longer.
Is now a good time to sell my house in Mississauga?
It depends on your plans. In August 2026 about 42 percent of new detached listings sold and there were about 5.2 months of supply (my arithmetic), a balanced market where pricing decides the result. Semis were firmer. If you are buying and selling, plan both sides together.
Does Mississauga have a land transfer tax?
Mississauga has no municipal land transfer tax. Buyers pay only Ontario’s tax: $20,255 on a $1,189,000 house, August’s detached median, against $40,510 for the same price in Toronto (my arithmetic, before first-time buyer refunds).
Sources
- TRREB — Market Watch, August 2026 — detached, semi-detached and freehold townhouse tables, and the MLS HPI benchmark
- Government of Ontario — Calculating land transfer tax — provincial brackets
- Government of Ontario — Land transfer tax refunds for first-time homebuyers — up to $4,000
- City of Toronto — Municipal Land Transfer Tax rates and fees — Toronto only
- MPAC — Assessment cycle — 2026 taxes still based on 1 January 2016 values
- CRA — Reporting the sale of your principal residence — report the sale even when fully exempt
Related reading
- How much is my house worth in Brampton?
- How much is my house worth in Oakville?
- How much is my house worth in Milton?
- How much is my condo worth in Mississauga?
- Mississauga home values
- Choosing a realtor in Mississauga
- What is my home worth in Toronto and the GTA?
About the author — Jatin Dua, Toronto and GTA real estate broker
I am Jatin Dua, Broker of Record and co-founder of RE/MAX Quantum Realty Inc., Brokerage, Unit 101, 799 The Queensway, Toronto. I work with buyers and sellers across Toronto and the GTA and have helped more than 100 families sell. Four-plus years of active GTA transactions and over $100 million in sales volume. Every figure here comes from a published table, regulator or statute linked in the sources, so you can check all of it without asking me.
Reach me at connect@jatindua.com or 833-330-1925, or book a call.