

Published 29 September 2026 · By Jatin Dua, Broker of Record, RE/MAX Quantum Realty
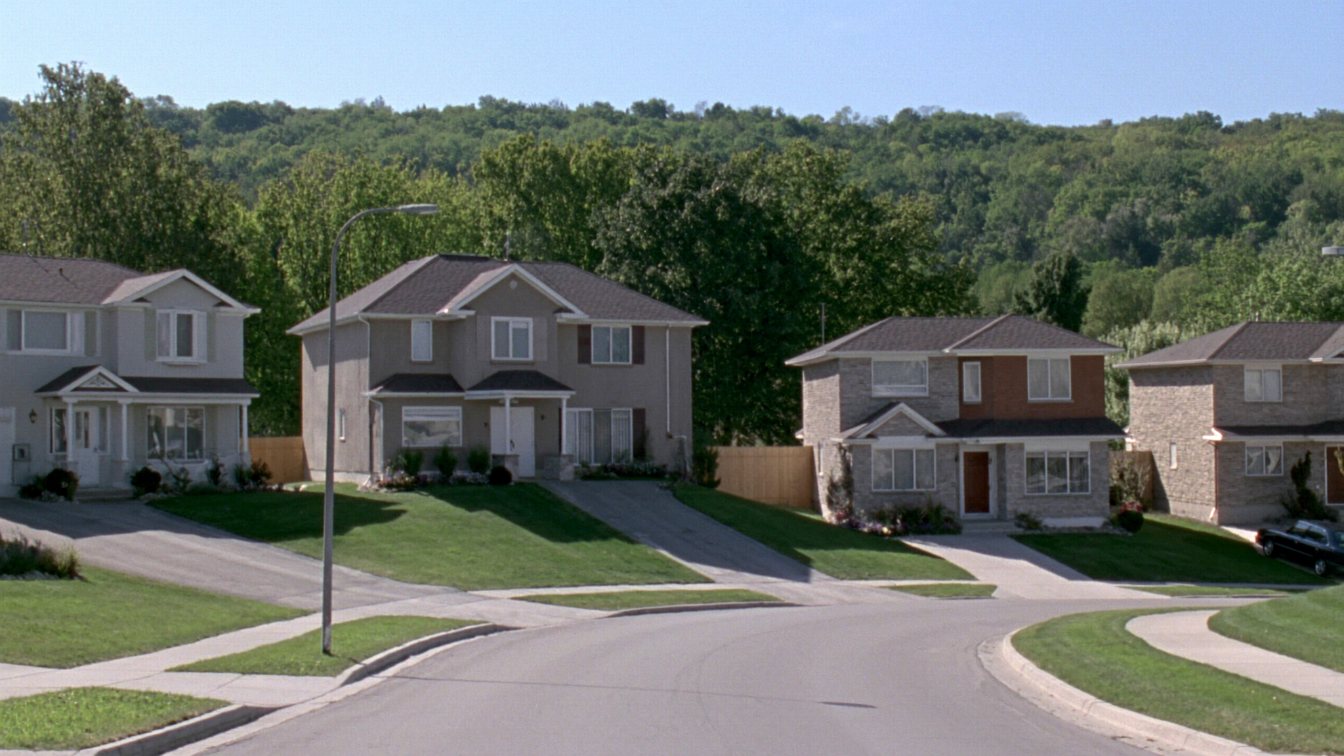
In August 2026 TRREB recorded 89 detached sales in Burlington at a median of $1,250,000 and an average of $1,421,482, selling at 97 percent of list price after 33 days on average. Semi-detached houses had a median of $898,500 across 12 sales, and freehold townhouses $870,000 across 15 sales, both small samples. TRREB’s benchmark for a typical Burlington detached house was $1,209,900, down 3.54 percent from August 2025. Burlington was the tightest detached market in Halton: 270 active listings against 89 sales is about 3.0 months of supply (my arithmetic), against 4.2 across Halton and 5.0 in Oakville. A well-priced house should sell close to asking, but the benchmark shows prices are still slightly lower than a year ago, so price from recent comparable sales.
Burlington house prices by home type, August 2026
| Home type, August 2026 | Sales | Median | Average | Sale to list | Avg. days on market | New listings | Active listings | Months of inventory (calc.) | Sales to new listings (calc.) |
|---|---|---|---|---|---|---|---|---|---|
| Detached | 89 | $1,250,000 | $1,421,482 | 97% | 33 | 163 | 270 | 3.0 | 55% |
| Semi-detached | 12 | $898,500 | $871,142 | 99% | 31 | 15 | 20 | 1.7 | 80% |
| Freehold townhouse | 15 | $870,000 | $847,133 | 96% | 41 | 34 | 50 | 3.3 | 44% |
Source: TRREB Market Watch, August 2026. The two calculated columns are my arithmetic: active listings divided by sales, and sales divided by new listings. One month of data: the 12 semi-detached and 15 freehold townhouse sales are small samples, so a couple of unusual sales can move those medians. The detached row, with 89 sales, is the one to anchor on.
The detached average was $171,482 above the median (my arithmetic). Burlington has a luxury segment, mainly larger houses near the lake and on estate lots, and a few of those in one month lift the average. For semis and townhouses the average sat below the median, which simply means a few cheaper sales that month; with samples this small, do not read much into it.
How Burlington compares with Halton, its neighbours and Toronto
| August 2026 | Burlington | Halton Region | Oakville | Milton | Mississauga | City of Toronto | All TRREB |
|---|---|---|---|---|---|---|---|
| Detached sales | 89 | 292 | 103 | 59 | 164 | 550 | 2,399 |
| Detached median | $1,250,000 | $1,300,000 | $1,604,000 | $1,130,000 | $1,189,000 | $1,170,000 | $1,100,000 |
| Detached average | $1,421,482 | $1,457,343 | $1,787,896 | $1,238,259 | $1,275,221 | $1,525,749 | $1,288,669 |
| Detached sale to list | 97% | 96% | 95% | 98% | 97% | 97% | 97% |
| Detached days on market | 33 | 34 | 41 | 30 | 33 | 30 | 33 |
| Detached months of inventory (calc.) | 3.0 | 4.2 | 5.0 | 4.2 | 5.2 | 4.4 | 4.7 |
| Semi-detached median | $898,500 | $926,000 | $957,000 | $925,000 | $881,000 | $981,000 | $866,000 |
| Freehold townhouse median | $870,000 | $850,500 | $946,000 | $810,000 | $855,000 | $962,000 | $840,000 |
Source: TRREB Market Watch, August 2026; months of inventory is my arithmetic. Burlington’s detached median was $50,000 below the Halton figure and $354,000 below Oakville, but $120,000 above Milton and $80,000 above the City of Toronto (my arithmetic). The stand-out number is supply: 3.0 months of detached inventory is the lowest of any municipality in this table, and 55 percent of new detached listings sold, against 48 percent across Halton.
Are house prices going down in Burlington? The benchmark
| MLS HPI benchmark, August 2026 | Burlington | Change vs Aug 2025 | Halton Region | Change | All TRREB | Change |
|---|---|---|---|---|---|---|
| Composite (all types) | $849,900 | −2.97% | $960,100 | −2.95% | $925,900 | −4.46% |
| Single-family detached | $1,209,900 | −3.54% | $1,315,800 | −3.41% | $1,209,600 | −4.50% |
| Single-family attached | $889,200 | −1.72% | $871,900 | −4.91% | $919,000 | −4.40% |
| Townhouse | $639,900 | −5.52% | $640,900 | −5.53% | $666,500 | −6.18% |
The HPI benchmark is TRREB’s model price for a “typical” home of each type in the area, not a sale price and not the median. Because it describes a typical home rather than whatever happened to sell that month, it is the fairer way to answer “are prices going down”.
Slightly, year over year. The typical Burlington detached house was benchmarked 3.54 percent lower than in August 2025; by my arithmetic that is about $44,000 off a benchmark of roughly $1,254,000 a year earlier. The attached benchmark held up best, down only 1.72 percent. Those declines are smaller than the TRREB-wide figures. The detached median ($1,250,000) sat $40,100 above the benchmark (my arithmetic), a normal gap for one month’s mix of sales. For the wider outlook, see will house prices drop in 2027.
How TRREB reports Burlington, and why your pocket matters
TRREB publishes no district codes for Burlington; the Market Watch shows one city total inside Halton Region. That total mixes several markets:
- South Burlington near the lake: Roseland, Shoreacres, downtown and the lakeshore. Larger lots, older and rebuilt houses, and the high-end sales that lift the average.
- Aldershot, in the west end. Older housing stock, closer to Hamilton, with Aldershot GO nearby.
- Central and north Burlington: Tyandaga, Brant Hills, Headon Forest, Millcroft and the Orchard. Established subdivisions from roughly the 1960s to the 1990s, where condition and lot shape set the price.
- Alton Village and the north-east. Newer subdivisions near Highway 407, with more freehold townhouses and newer detached homes.
North of the urban boundary, rural Burlington along the Niagara Escarpment is its own market of acreage properties; the town-wide median says little about those.
What the numbers mean for your list price
Burlington’s detached market was the firmest in Halton in August. At about 3.0 months of supply (my arithmetic), well-priced houses do not sit long, and houses that sold went for 97 percent of their list price after 33 days on average. About 55 percent of new detached listings found buyers (89 sales against 163 new listings).
That is not the same as a bidding-war market. The 97 percent ratio counts only houses that sold, against their final list price, and the benchmark still shows prices a little lower than a year ago. A house priced in line with recent comparables should sell close to asking; one priced above them will still wait. Freehold townhouses were slower in August, at 41 days on average, though 15 sales is a small sample. See how long it takes to sell a house in 2026 for more on timing.
What moves your Burlington house above or below the median
- Lot frontage and depth. Wide, deep lots south of the QEW and near the lake command the most, especially where a rebuild is possible. See how lot size and frontage drive value.
- Home type. The detached median ($1,250,000) sat $351,500 above the semi median and $380,000 above the freehold townhouse median (my arithmetic); that gap outweighs most renovations.
- Street and sub-area. South versus north of the QEW, Aldershot versus Alton Village, a quiet court versus a busy arterial road.
- Schools. Families shop by catchment; know which schools your address feeds.
- Transit and highways. Access to Burlington, Appleby or Aldershot GO on the Lakeshore West line, and to the QEW, Highway 403 and Highway 407, matters to commuters heading to Toronto or Hamilton.
- Basement. A finished basement with good height, a separate entrance or a legal second unit widens your buyer pool.
- Garage and parking. An attached garage and a wide driveway are expected on detached houses here.
- Renovation level. Updated kitchens and bathrooms matter most in the 1970s and 1980s subdivisions, where many houses are original.
- Age and big-ticket systems. Roof, windows, furnace and air conditioning, electrical and plumbing. Keep dates and receipts; buyers of older houses will ask.
The land transfer tax point
Burlington has no municipal land transfer tax. At the $1,250,000 detached median, a buyer pays $21,475 in Ontario land transfer tax. The same purchase in Toronto would add a matching $21,475 municipal tax, $42,950 in total (my arithmetic from the published brackets, before first-time buyer refunds of up to $4,000 in Ontario and up to $4,475 in Toronto).
For a buyer comparing a Burlington house with one in Toronto, that is $21,475 that can go toward the price instead of tax. Test other prices in the land transfer tax calculator.
How to get an accurate number for your Burlington house
Two tools help here: the AI home value estimator below gives you a range for your house in about a minute, and the net proceeds calculator turns any price into what actually lands in your account.
Then get a broker price opinion, or a comparative market analysis, from the last few months of sales of houses like yours: same type, similar lot, same part of the city, adjusted for size, basement, garage, updates and condition, and checked against what is for sale today. Your MPAC assessment is not a guide; 2026 property taxes are still based on 1 January 2016 values. The Burlington home values page tracks the city between reports, and what did my neighbour sell for explains how to read nearby sales.
Comparing towns? See what houses are worth in Oakville and in Milton, or what Burlington condos are worth if you are downsizing. When you have your estimator range, book a call or phone 833-330-1925 and I will build the comparables with you.
Free tool — AI home value estimator
Instant Home Valuation
What’s your home
worth today?
Answer six quick questions and get an instant value range built from current Toronto & GTA sale data — property type, size, condition, lot and location all weighted the way a real pricing conversation weighs them. Takes about ninety seconds.
Reading recent GTA sale data…
Building your estimate
Estimated market value
—
$0–$0
Most likely value $0 · roughly $0 per square foot
What moved the number
Starting from the area baseline for your property type, here’s what each answer added or subtracted.
Market context
Recent local averages for comparison.
—
A range is a starting point.
A strategy is what sells.
This model doesn’t know that your neighbour’s identical semi went $80,000 over asking last month, or which two upgrades actually pay back in your area. That conversation is free and takes twenty minutes.
Frequently asked questions
How much is a detached house worth in Burlington in 2026?
In August 2026 Burlington detached houses sold at a median of $1,250,000 and an average of $1,421,482 across 89 sales, according to TRREB. The benchmark for a typical detached house was $1,209,900. Lakeside and estate homes sit well above those numbers, and older houses needing work below them, so price yours from recent comparable sales.
Are house prices going down in Burlington?
Slightly, year over year. TRREB’s benchmark for a typical Burlington detached house was $1,209,900 in August 2026, 3.54 percent below August 2025, roughly $44,000 by my arithmetic. The all-types benchmark fell 2.97 percent. Both declines were smaller than across TRREB as a whole, and Burlington had the tightest detached supply in Halton.
Is now a good time to sell my house in Burlington?
Burlington was the firmest detached market in Halton in August 2026, with about 3.0 months of supply and houses selling at 97 percent of list price after 33 days. That favours sellers who price from recent comparables. Prices are still a little lower than a year ago, so an ambitious list price is more likely to sit than to spark competing offers.
How long does it take to sell a house in Burlington?
In August 2026 Burlington detached houses that sold took 33 days on average, semi-detached houses 31 days and freehold townhouses 41 days, according to TRREB. The semi and townhouse samples were small. These are averages for houses that sold; an overpriced house can sit far longer and usually needs a price change.
What is the average price of a semi-detached house in Burlington?
Burlington semi-detached houses averaged $871,142 in August 2026, with a median of $898,500, according to TRREB. That was only 12 sales, so a few unusual sales can move the figure a lot. Across Halton Region, with 28 sales, the semi-detached median was $926,000.
Does Burlington have a municipal land transfer tax?
No. Burlington buyers pay only the Ontario land transfer tax, which is $21,475 at the August 2026 detached median of $1,250,000 by my arithmetic from the published brackets. The same purchase in Toronto would cost $42,950 because the City charges its own matching tax. First-time buyers may qualify for a provincial refund of up to $4,000.
Sources
- TRREB — Market Watch, August 2026 — detached, semi-detached and freehold townhouse tables, and the MLS HPI benchmark
- Government of Ontario — Calculating land transfer tax — provincial brackets
- Government of Ontario — Land transfer tax refunds for first-time homebuyers — up to $4,000
- City of Toronto — Municipal Land Transfer Tax rates and fees — Toronto only
- MPAC — Assessment cycle — 2026 taxes still based on 1 January 2016 values
Related reading
- How much is my house worth in Oakville?
- How much is my house worth in Milton?
- How much is my house worth in Mississauga?
- How much is my condo worth in Burlington?
- Burlington home values
- Choosing a realtor in Burlington
- What is my home worth in Toronto and the GTA?
- What is a comparative market analysis?
About the author — Jatin Dua, Toronto and GTA real estate broker
I am Jatin Dua, Broker of Record and co-founder of RE/MAX Quantum Realty Inc., Brokerage, Unit 101, 799 The Queensway, Toronto. I work with buyers and sellers across Toronto and the GTA and have helped more than 100 families sell. Four-plus years of active GTA transactions and over $100 million in sales volume. Every figure here comes from a published table, regulator or statute linked in the sources, so you can check all of it without asking me.
Reach me at connect@jatindua.com or 833-330-1925, or book a call.