

Published 29 September 2026 · By Jatin Dua, Broker of Record, RE/MAX Quantum Realty
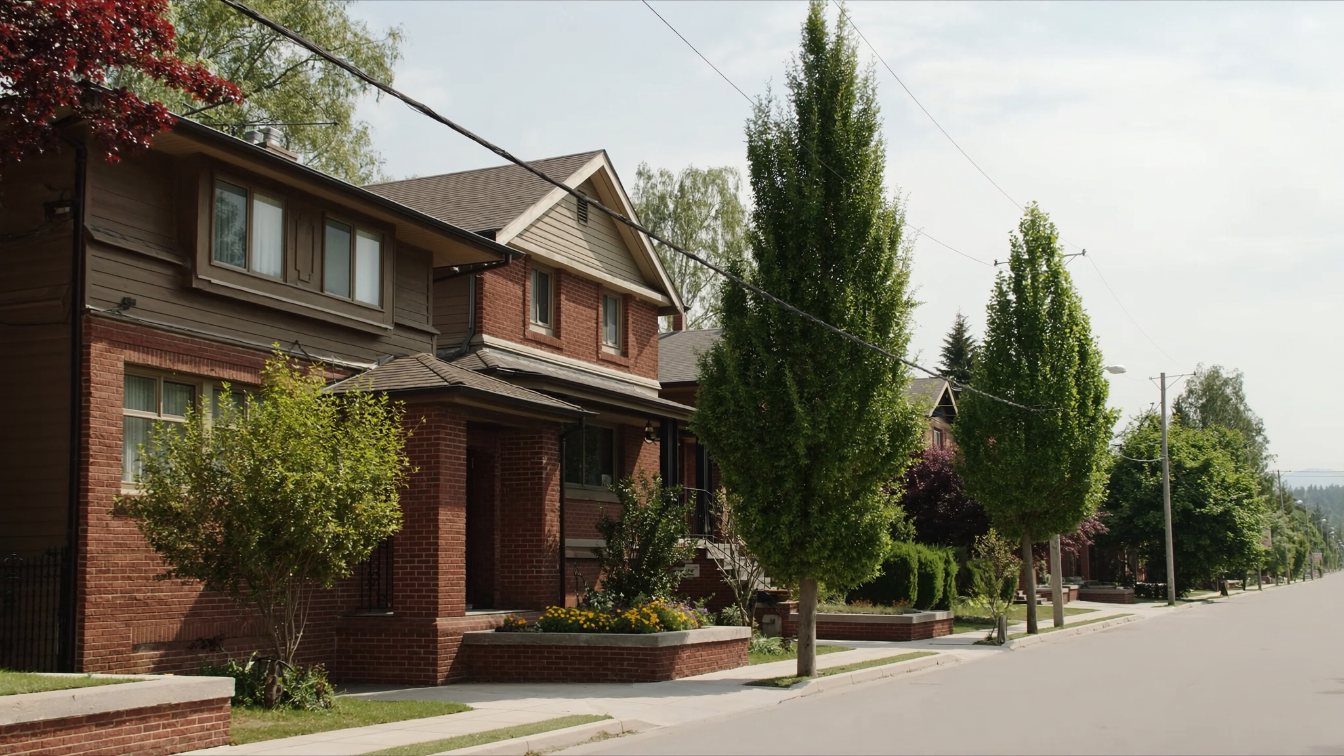
In August 2026 TRREB recorded 67 detached and 27 semi-detached sales across the West End’s four districts. Detached medians were $1,700,000 in W01 (High Park, Roncesvalles, Parkdale), $1,228,000 in W02 (the Junction, Bloor West Village), $874,500 in W03 (Corso Italia-Davenport, Rockcliffe-Smythe) and $950,000 in W04 (York, Weston, Maple Leaf). By my arithmetic the 67 detached sales averaged $1,084,160 and the 27 semis $1,088,132. Houses sold at 97 to 102 percent of list, and detached supply was about 3.5 months, tighter than the City of Toronto’s 4.4. TRREB’s detached benchmark rose 0.98 percent year over year in W02 but fell in W01, W03 and W04, by up to 8.46 percent. W01 had only five detached sales, so its benchmark of $1,930,000 is a steadier guide.
West End house prices by home type, August 2026
| August 2026 | West End (W01–W04) | Toronto West | City of Toronto | All TRREB |
|---|---|---|---|---|
| Detached sales | 67 | 185 | 550 | 2,399 |
| Detached median | not published for the four districts combined | $1,100,000 | $1,170,000 | $1,100,000 |
| Detached average | $1,084,160 (calculated) | $1,327,593 | $1,525,749 | $1,288,669 |
| Detached sale to list | about 99% (calculated) | 98% | 97% | 97% |
| Detached days on market | about 29 (calculated) | 28 | 30 | 33 |
| Semi-detached sales | 27 | 57 | 159 | 439 |
| Semi median | not published | $875,000 | $981,000 | $866,000 |
| Semi average | $1,088,132 (calculated) | $965,045 | $1,110,639 | $931,665 |
| Semi sale to list / days | about 102% / 30 (calculated) | 100% / 32 | 100% / 27 | 99% / 28 |
| Freehold townhouse sales | 5 | 20 | 45 | 437 |
| Townhouse median | not published | $1,004,000 | $962,000 | $840,000 |
| Townhouse average | $1,093,200 (calculated) | $1,010,850 | $1,026,018 | $882,060 |
Source: TRREB Market Watch, August 2026. The West End column is my arithmetic from the four district rows: total dollar volume divided by total sales for the average, and sale-to-list and days on market weighted by each district’s sales. Toronto West also includes Etobicoke and the north-west districts (W05 to W10), so it is a wider market, not a West End figure. Five townhouse sales are far too few to price from.
District by district: detached and semi-detached
| Detached, August 2026 | Main neighbourhoods | Sales | Median | Average | Sale to list | Days on market | Months of inventory (calculated) |
|---|---|---|---|---|---|---|---|
| W01 | High Park, Roncesvalles, Parkdale | 5 | $1,700,000 | $1,925,520 | 102% | 24 | 4.4 |
| W02 | Junction, Bloor West Village, Runnymede | 9 | $1,228,000 | $1,277,333 | 101% | 22 | 3.9 |
| W03 | Keelesdale, Rockcliffe-Smythe, Weston-Pellam Park, Corso Italia-Davenport | 24 | $874,500 | $953,767 | 99% | 28 | 2.7 |
| W04 | York, Weston, Maple Leaf, Yorkdale-Glen Park | 29 | $950,000 | $987,059 | 97% | 34 | 3.8 |
| Semi-detached, August 2026 | Sales | Median | Average | Sale to list | Days on market |
|---|---|---|---|---|---|
| W01 | 3 | $1,355,000 | $1,335,107 | 92% | 38 |
| W02 | 10 | $1,110,000 | $1,148,725 | 105% | 28 |
| W03 | 10 | $1,117,500 | $1,086,200 | 104% | 27 |
| W04 | 4 | $752,500 | $756,250 | 97% | 36 |
Months of inventory is my arithmetic: active listings divided by sales. Every West End district had fewer than 15 detached sales except W03 and W04, and every district had 10 or fewer semi sales. W01’s five detached and three semi sales cannot tell you what High Park or Roncesvalles houses are worth; they tell you what five houses sold for.
Semis are a large share of this market: 27 semi sales against 67 detached, where across the City of Toronto semis were 159 against 550 (TRREB’s counts). In W02 and W03, semis sold at 104 to 105 percent of list, the strongest ratios in the West End. W03’s semi median ($1,117,500) even sat above its detached median ($874,500). That is the mix, not a rule: the semis that sold were likely on different streets from the detached houses. Price a semi from semis.
The West End was tight on supply. About 61 percent of new detached listings sold (67 of 109, my arithmetic), against 47 percent citywide, and W03 had only 2.7 months of inventory.
Are West End house prices going down? The benchmark trend
| District | Composite benchmark | Year over year | Detached benchmark | Year over year |
|---|---|---|---|---|
| W01 | $996,500 | −2.77% | $1,930,000 | −4.24% |
| W02 | $1,155,000 | +0.18% | $1,617,900 | +0.98% |
| W03 | $861,400 | −4.45% | $924,100 | −6.27% |
| W04 | $780,200 | −7.18% | $1,016,500 | −8.46% |
| City of Toronto | $918,400 | −3.73% | $1,437,900 | −4.33% |
| All TRREB | $925,900 | −4.46% | $1,209,600 | −4.50% |
The benchmark is TRREB’s MLS® Home Price Index model price for a “typical” home in each district, not an actual sale.
The West End splits in two. W02, the Junction and Bloor West Village, is the only district in this guide where the detached benchmark rose year over year, by 0.98 percent. W01 fell 4.24 percent, in line with the city. W03 fell 6.27 percent and W04 8.46 percent, both faster than the City of Toronto’s 4.33 percent. So the answer depends on which side of the West End you are on. For W01, where only five houses sold, the $1,930,000 benchmark is a steadier anchor than the $1,700,000 August median. For the longer view, see will Toronto house prices drop in 2027.
What the numbers mean for your list price
Low supply and sale-to-list ratios at or above 100 percent in W01, W02 and W03 mean that a well-presented house, priced from recent sold comparables, can draw more than one buyer. W04 was softer: 97 percent of list, 34 days on market, and the steepest benchmark drop.
- In W01 to W03, price to the comparables, then present well. A small, tight market rewards preparation: repairs done, the house cleaned and staged, the pre-listing paperwork ready.
- Offer dates are a tactic, not a promise. They work when demand is there. If the comparables do not support a bidding war, holding offers can cost you weeks.
- In W04, price precisely. Buyers there had more choice and more time.
For timing, read how long it takes to sell a house in Toronto.
What moves your West End house above or below the median
- Lot frontage and depth. West End lots are often narrow city lots. An extra few feet of frontage, a deeper lot or a lane at the back (which may allow a laneway suite) all add value. See laneway suites in Toronto.
- Detached or semi. Price a semi from semi sales, as the district table shows.
- The basement. Ceiling height matters in older houses. A basement that has been underpinned, with a separate entrance and a legal second unit, is worth more than one with a low ceiling and no permits. See buying a duplex or triplex in Toronto.
- Parking. Many older streets have no driveway or a shared mutual drive. A private drive or a garage off the lane is a real advantage here; a mutual drive is a question buyers will ask about.
- Renovation level. A fully renovated century house and an original one on the same street can sell hundreds of thousands apart. Buyers pay most for work done properly, with permits.
- Street and sub-area. Streets near High Park, Roncesvalles or Bloor West Village, or on a quiet one-way street, draw more buyers than houses on a busy arterial or next to a rail corridor.
- Schools. Families ask about catchments and French immersion. Confirm your address with the school board; do not rely on an older listing.
- Transit. Walking distance to Line 2 (High Park, Keele, Dundas West, Runnymede, Jane), the UP Express and Kitchener GO stops at Bloor and Weston, or Line 1 near Yorkdale adds to your buyer pool.
- Age and big-ticket systems. Older West End houses may still have knob-and-tube wiring, an older electrical service, galvanized or lead water pipes, or an aging roof and furnace. Insurers and buyers ask; updates with receipts support your price.
The land transfer tax point
A West End buyer pays Ontario land transfer tax and Toronto’s municipal tax. Below $3,000,000 the Toronto tax uses the same brackets, so the total is double the provincial amount. A buyer comparing with Mississauga pays only the Ontario tax.
| Price (August 2026 detached median) | Ontario LTT | Toronto MLTT | Total |
|---|---|---|---|
| $874,500 (W03) | $13,965 | $13,965 | $27,930 |
| $950,000 (W04) | $15,475 | $15,475 | $30,950 |
| $1,228,000 (W02) | $21,035 | $21,035 | $42,070 |
| $1,700,000 (W01) | $30,475 | $30,475 | $60,950 |
My arithmetic from the published brackets, before first-time buyer refunds (up to $4,000 from Ontario, up to $4,475 from Toronto). Many West End semi buyers are first-time buyers, and those refunds help at the margin. The tax does not come out of your proceeds, but it is cash your buyer needs on closing. Try any price in the land transfer tax calculator.
How to get an accurate number for your house
Two tools help here: the AI home value estimator below gives you a range for your house in about a minute, and the net proceeds calculator turns any price into what actually lands in your account.
Then get a broker price opinion or comparative market analysis: recent sales of comparable detached houses or semis, adjusted for lot, basement height, parking, renovation level and street, and checked against what is listed now. Your MPAC assessment will not help; 2026 property taxes are still based on 1 January 2016 values.
For neighbourhood detail, see the home-value pages for High Park, Roncesvalles and Parkdale, the Junction and Bloor West Village, Corso Italia and Davenport and Weston, Maple Leaf and Yorkdale. Comparing markets? See what houses are worth in the East End, midtown Toronto and Mississauga, or next door in Etobicoke. If this is your principal residence, you still report the sale to CRA; your accountant can confirm the details.
Where I fit
My office is on The Queensway and I work across Toronto and the GTA. In the West End I price from the handful of sales that really compete with your house, street by street. When you have your estimator range, book a call or phone 833-330-1925.
Free tool — AI home value estimator
Instant Home Valuation
What’s your home
worth today?
Answer six quick questions and get an instant value range built from current Toronto & GTA sale data — property type, size, condition, lot and location all weighted the way a real pricing conversation weighs them. Takes about ninety seconds.
Reading recent GTA sale data…
Building your estimate
Estimated market value
—
$0–$0
Most likely value $0 · roughly $0 per square foot
What moved the number
Starting from the area baseline for your property type, here’s what each answer added or subtracted.
Market context
Recent local averages for comparison.
—
A range is a starting point.
A strategy is what sells.
This model doesn’t know that your neighbour’s identical semi went $80,000 over asking last month, or which two upgrades actually pay back in your area. That conversation is free and takes twenty minutes.
Frequently asked questions
How much is a detached house worth in Toronto’s West End?
In August 2026 TRREB’s detached medians were $1,700,000 in W01 (High Park, Roncesvalles, Parkdale), $1,228,000 in W02 (Junction, Bloor West Village), $874,500 in W03 (Corso Italia-Davenport) and $950,000 in W04 (York, Weston). W01 and W02 had only five and nine sales, so TRREB’s benchmarks of $1,930,000 and $1,617,900 are steadier guides.
Are house prices going down in the West End of Toronto?
It depends on the district. TRREB’s August 2026 detached benchmark rose 0.98 percent year over year in W02, the Junction and Bloor West Village, but fell 4.24 percent in W01, 6.27 percent in W03 and 8.46 percent in W04. The City of Toronto as a whole fell 4.33 percent.
Is now a good time to sell my house in the West End?
Supply was tight in August 2026: about 61 percent of new West End detached listings sold and there were about 3.5 months of inventory, against 4.4 across the City of Toronto. W01 to W03 sold at or above list on average. A well-prepared house priced from recent sold comparables is in a good position.
How long does it take to sell a house in High Park or the Junction?
In August 2026 detached houses averaged 24 days on market in W01 (High Park, Roncesvalles) and 22 days in W02 (Junction, Bloor West Village), on small samples of five and nine sales. Semis averaged 38 and 28 days. Then allow for the closing period agreed in the offer.
What is the average price of a semi in the West End of Toronto?
By my arithmetic the 27 West End semi sales in August 2026 averaged $1,088,132. District medians were $1,355,000 in W01, $1,110,000 in W02, $1,117,500 in W03 and $752,500 in W04, all on samples of 10 or fewer. Recent semi sales on your own street are the better guide.
Sources
- TRREB — Market Watch, August 2026 — detached, semi-detached and freehold townhouse tables, and the MLS HPI benchmark
- Government of Ontario — Calculating land transfer tax — provincial brackets
- Government of Ontario — Land transfer tax refunds for first-time homebuyers — up to $4,000
- City of Toronto — Municipal Land Transfer Tax rates and fees — Toronto only
- MPAC — Assessment cycle — 2026 taxes still based on 1 January 2016 values
- CRA — Reporting the sale of your principal residence — report the sale even when fully exempt
Related reading
- How much is my house worth in the East End?
- How much is my house worth in midtown Toronto?
- How much is my house worth in North York?
- How much is my house worth in Mississauga?
- What is my home worth in Etobicoke?
- Choosing a realtor in Toronto
- What is my home worth in Toronto and the GTA?
About the author — Jatin Dua, Toronto and GTA real estate broker
I am Jatin Dua, Broker of Record and co-founder of RE/MAX Quantum Realty Inc., Brokerage, Unit 101, 799 The Queensway, Toronto. I work with buyers and sellers across Toronto and the GTA and have helped more than 100 families sell. Four-plus years of active GTA transactions and over $100 million in sales volume. Every figure here comes from a published table, regulator or statute linked in the sources, so you can check all of it without asking me.
Reach me at connect@jatindua.com or 833-330-1925, or book a call.