

Published 29 September 2026 · By Jatin Dua, Broker of Record, RE/MAX Quantum Realty
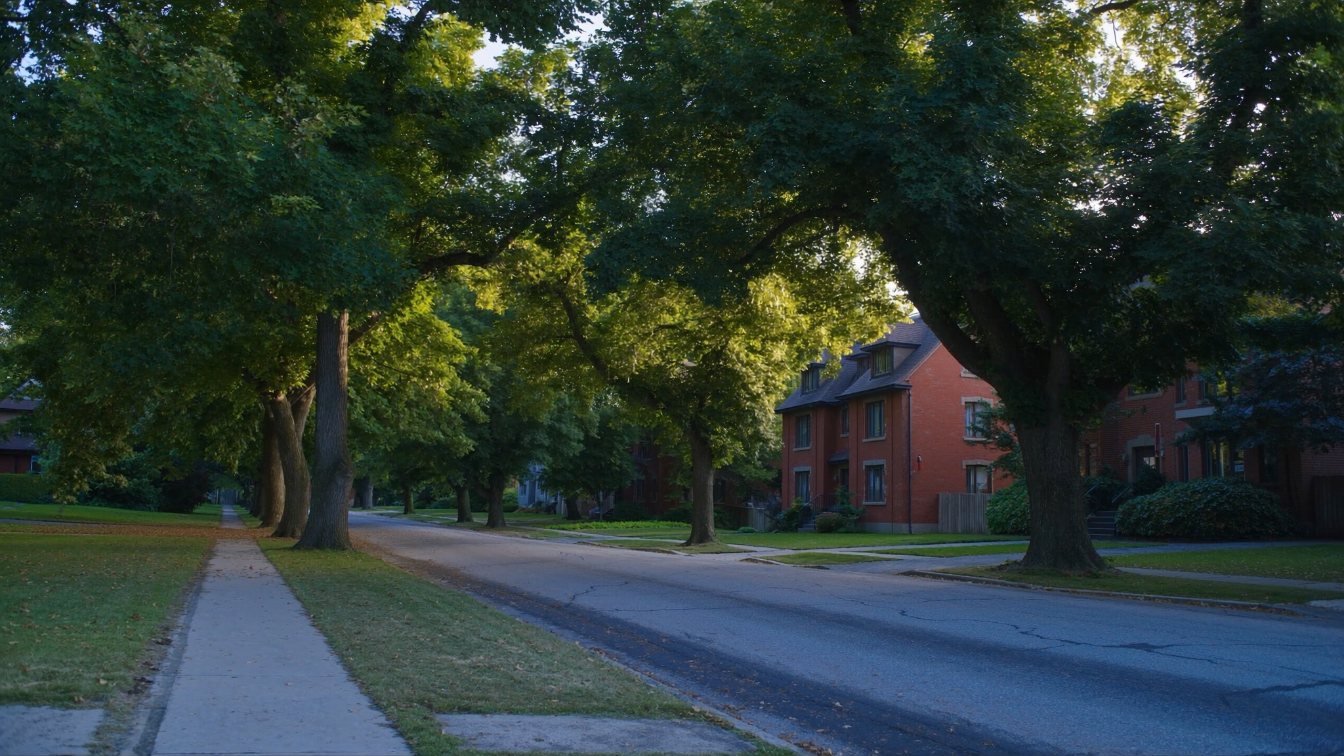
In August 2026 TRREB recorded 68 detached sales across midtown Toronto’s six districts (C02, C03, C04, C09, C10 and C11). District medians ran from $1,484,000 in C03 (Forest Hill South, Cedarvale, Oakwood-Vaughan) to $4,140,000 in C09 (Rosedale, Moore Park), with C04 (Lawrence Park, Bedford Park, Forest Hill North) at $2,356,850 on 24 sales, the largest sample. TRREB’s detached HPI benchmark, its model price for a typical house, was lower than a year earlier in all six districts, from −0.17 percent in C04 to −9.61 percent in C09. Only 20 semis sold, and no freehold townhouse sold in any of the six. Every district sample is under 25 sales, so price your house from recent sales on comparable streets, not a district average. A Toronto buyer pays both Ontario and Toronto land transfer tax: $90,792.50 at C04’s median (my arithmetic).
Midtown detached prices by district, August 2026
TRREB publishes no single “midtown” number; six lettered districts make up what most people mean by midtown.
| District (main neighbourhoods) | Sales | Median | Average | Sale to list | Days on market | Active listings |
|---|---|---|---|---|---|---|
| C02 (Annex, Yorkville, Casa Loma) | 3 | $1,645,000 | $3,521,667 | 91% | 70 | 31 |
| C03 (Forest Hill South, Humewood-Cedarvale, Oakwood-Vaughan) | 18 | $1,484,000 | $3,329,722 | 100% | 33 | 83 |
| C04 (Lawrence Park, Bedford Park, Forest Hill North) | 24 | $2,356,850 | $2,531,113 | 96% | 21 | 132 |
| C09 (Rosedale, Moore Park) | 7 | $4,140,000 | $4,575,571 | 94% | 56 | 32 |
| C10 (Mount Pleasant, Davisville) | 5 | $2,525,000 | $2,289,400 | 98% | 19 | 18 |
| C11 (Leaside, Thorncliffe, Flemingdon) | 11 | $2,250,000 | $2,456,909 | 99% | 19 | 14 |
| Six districts combined (calculated) | 68 | not published | $2,966,893 | — | — | 310 |
| Toronto Central (TRREB) | 171 | $1,800,000 | $2,246,038 | 96% | 33 | 952 |
| City of Toronto | 550 | $1,170,000 | $1,525,749 | 97% | 30 | 2,401 |
Source: TRREB Market Watch, August 2026, detached. The combined row is my arithmetic: total dollar volume of the six districts divided by their 68 sales. A median cannot be combined from district medians, so none is shown.
Three warnings. Every district had fewer than 25 sales (C02 had 3, C10 had 5, C09 had 7), so one unusual sale moves a median a lot. In C02 and C03 the average sat roughly $1.85 million above the median (my arithmetic): a few very large houses closed alongside ordinary ones. And C11 blends Leaside with Thorncliffe Park and Flemingdon Park, which have very different housing stock, so a Leaside detached house should be priced from Leaside sales, not the C11 figure. C04 also straddles the old North York boundary.
Semis and freehold townhouses: midtown against Toronto
| August 2026 | Midtown, 6 districts (calculated) | Toronto Central | City of Toronto | All TRREB |
|---|---|---|---|---|
| Detached sales | 68 | 171 | 550 | 2,399 |
| Detached median | by district, above | $1,800,000 | $1,170,000 | $1,100,000 |
| Detached average | $2,966,893 | $2,246,038 | $1,525,749 | $1,288,669 |
| Semi-detached sales | 20 | 53 | 159 | 439 |
| Semi-detached median | not published | $1,110,000 | $981,000 | $866,000 |
| Semi-detached average | $1,658,511 | $1,344,929 | $1,110,639 | $931,665 |
| Semi sale to list | 92% to 108% by district | 98% | 100% | 99% |
| Semi days on market | 4 to 59 by district | 28 | 27 | 28 |
| Freehold townhouse sales | 0 | 10 | 45 | 437 |
| Freehold townhouse median | no sales | $1,173,500 | $962,000 | $840,000 |
| Townhouse sale to list | — | 95% | 98% | 98% |
| Townhouse days on market | — | 31 | 28 | 31 |
Source: TRREB Market Watch, August 2026. Midtown totals and averages are my arithmetic from the six district rows.
Semis are thin on the ground. C02 had the most, 7 sales at a $2,100,000 median, which reflects the large Annex and Casa Loma semis. C09 had 3 at $2,101,027, C10 had 3 at $1,550,000, C11 had 4 at $1,182,500, C03 had 2 at $1,215,000 and C04 had 1 at $1,150,000. With counts like that, treat each figure as a single data point, not a market price. Not one freehold townhouse sold in the six districts in August, so if you own one, your comparables will come from several months of sales and from Toronto Central’s 10 sales at a $1,173,500 median.
Are midtown house prices going down? The HPI benchmark
The MLS® Home Price Index benchmark is TRREB’s model price for a typical home with fixed features in each area. It is not a sale, but because it holds the house constant it is the better guide to direction than a one-month median.
| District | Detached benchmark | Change vs Aug 2025 | Attached (semi) benchmark | Change vs Aug 2025 |
|---|---|---|---|---|
| C02 | $2,582,700 | −0.81% | $1,811,700 | −1.71% |
| C03 | $1,836,900 | −5.68% | $1,167,900 | −4.92% |
| C04 | $2,464,400 | −0.17% | $1,436,900 | −2.24% |
| C09 | $3,485,900 | −9.61% | $2,358,200 | −5.35% |
| C10 | $1,978,100 | −2.43% | $1,437,100 | −3.47% |
| C11 | $2,227,300 | −6.93% | $1,348,400 | −8.43% |
| City of Toronto | $1,437,900 | −4.33% | $1,127,200 | −4.07% |
| All TRREB | $1,209,600 | −4.50% | $919,000 | −4.40% |
Source: TRREB Market Watch, August 2026, MLS® HPI.
So yes, the typical midtown house was worth less than a year earlier, but not evenly. Lawrence Park and the Annex benchmarks were close to flat. Rosedale and Moore Park fell the most, and C11 and C03 fell further than the city as a whole. If you are asking whether to wait, read will Toronto house prices drop in 2027; I do not forecast, but that post sets out what the data can and cannot tell you.
What the numbers mean for your list price
Across the six districts, 310 detached houses were for sale against 68 sales, about 4.6 months of inventory, and 68 sales against 156 new listings is a sales-to-new-listings ratio of about 44 percent (my arithmetic). That is close to balanced, but the districts differed:
- C04 sold at 96 percent of list in 21 days on average, with about 5.5 months of supply. Correctly priced houses moved quickly.
- C11 was the tightest: 11 sales against 10 new listings and only 14 active, about 1.3 months of supply, at 99 percent of list in 19 days.
- C09 sold at 94 percent of list and took 56 days on average. At Rosedale prices, buyers negotiate.
- C02 had 31 active listings against 3 sales, roughly 10 months of supply, at 91 percent of list and 70 days. A tiny sample, but overpriced houses clearly sat.
Sale-to-list only counts the houses that sold, measured against their final list price, which is often a reduced one. The practical rule in midtown: price from the last three to six months of sold houses on comparable streets, not from the best sale or the average. For more on timing, see how long it takes to sell a house in Toronto.
What moves your house above or below the district number
- Lot frontage and depth. In midtown the land is most of the value. A 50-foot lot on a quiet Lawrence Park or Leaside street and a 20-foot lot on a busier road are different products even in the same district. See how lot size and frontage drive value in Toronto.
- Ravine and park edges. Parts of Rosedale, Moore Park, Lawrence Park and Cedarvale back onto ravines. Buyers pay for the setting, but ravine rules limit what they can build, so read what to know about a ravine lot.
- Detached versus semi. In C02 a semi can still be a large Victorian house; in Leaside or Davisville a detached house on a similar lot usually trades well above the semi next door.
- Basement and second unit. A finished basement with good ceiling height helps. A separate entrance and a properly permitted second unit or laneway suite widens the buyer pool; an unpermitted one raises questions a buyer’s lawyer will ask.
- Parking. Many Annex, Casa Loma and Davisville houses have mutual drives, pad parking or none at all. A private drive and a garage matter here more than in most of the city.
- Renovation level. Midtown has three markets on one street: original condition, renovated, and new custom builds. Price against the same tier.
- Street and sub-area. Inside C11, Leaside and Thorncliffe are separate markets. Inside C03, Forest Hill South and Oakwood-Vaughan are too. The district median hides that.
- Schools. Buyers check school catchments before they book a showing. Confirm your address’s schools with the school board rather than relying on a listing.
- Transit. Walking distance to a Line 1 Yonge station such as Davisville, Eglinton or Lawrence, or to Line 2 on Bloor for the Annex, helps. The Eglinton Crosstown line runs along Eglinton Avenue, which borders several midtown districts.
- Age and big systems. Many midtown houses are close to a century old. Buyers and inspectors look hard at the roof, windows, furnace and air conditioning, the electrical panel and any original wiring, and the plumbing from the street in. Have your receipts ready.
Land transfer tax on a midtown house
Toronto buyers pay Ontario land transfer tax and the City of Toronto’s municipal land transfer tax, which uses matching brackets up to $3 million and higher luxury rates above that. At midtown prices this is a large cheque, and it shapes what a buyer can offer.
| Price (my arithmetic) | Ontario LTT | Toronto MLTT | Total |
|---|---|---|---|
| $1,800,000 (Toronto Central detached median) | $32,475 | $32,475 | $64,950 |
| $2,356,850 (C04 detached median) | $45,396.25 | $45,396.25 | $90,792.50 |
| $4,140,000 (C09 detached median) | $89,975 | $113,105 | $203,080 |
My arithmetic from the published brackets (Ontario tops out at 2.5 percent above $2 million; Toronto matches to $3 million, then charges 4.40 percent to $4 million and 5.45 percent to $5 million), before first-time buyer refunds (up to $4,000 provincial and $4,475 municipal), which rarely apply at these prices. Check any number with the land transfer tax calculator and read Toronto’s 2026 MLTT rates.
How to get an accurate number for your house
A district median is a starting line, not your price, and in midtown the samples are too small to lean on. Your MPAC assessment is not a guide either: 2026 property taxes are still based on 1 January 2016 values.
Two tools help here: the AI home value estimator below gives you a range for your house in about a minute, and the net proceeds calculator turns any price into what actually lands in your account.
Then get a broker price opinion, a comparative market analysis built from recent sales of comparable houses on comparable streets, adjusted for lot, parking, basement, renovation level and condition, and checked against what is for sale now. For neighbourhood-level figures, see the pages for the Annex, Casa Loma and Yonge-St. Clair, Forest Hill South, Cedarvale and Oakwood, Lawrence Park and Bedford Park, Rosedale and Moore Park, Mount Pleasant and Davisville and Leaside and Thorncliffe.
If you are comparing areas, see what houses are worth in North York, the West End and the East End, or, if you also own a unit, what midtown condos are worth.
Where I fit
I work with sellers across Toronto and the whole GTA, and I price midtown houses street by street, from the sales a buyer will actually compare yours with. When you have your estimator range, book a call or phone 833-330-1925 and I will walk you through the comparables.
Free tool — AI home value estimator
Instant Home Valuation
What’s your home
worth today?
Answer six quick questions and get an instant value range built from current Toronto & GTA sale data — property type, size, condition, lot and location all weighted the way a real pricing conversation weighs them. Takes about ninety seconds.
Reading recent GTA sale data…
Building your estimate
Estimated market value
—
$0–$0
Most likely value $0 · roughly $0 per square foot
What moved the number
Starting from the area baseline for your property type, here’s what each answer added or subtracted.
Market context
Recent local averages for comparison.
—
A range is a starting point.
A strategy is what sells.
This model doesn’t know that your neighbour’s identical semi went $80,000 over asking last month, or which two upgrades actually pay back in your area. That conversation is free and takes twenty minutes.
Frequently asked questions
How much is a detached house worth in midtown Toronto in 2026?
It depends heavily on the district. In August 2026 TRREB’s detached medians were $1,484,000 in C03, $1,645,000 in C02, $2,250,000 in C11, $2,356,850 in C04, $2,525,000 in C10 and $4,140,000 in C09. Every district had fewer than 25 sales, so your own street’s recent sales are a far better guide than any of those numbers.
Are house prices going down in midtown Toronto?
Year over year, yes. TRREB’s detached HPI benchmark was lower in August 2026 than in August 2025 in all six midtown districts, from −0.17 percent in C04 and −0.81 percent in C02 to −9.61 percent in C09. The City of Toronto benchmark fell 4.33 percent. One month of sales cannot show a trend on its own.
How long does it take to sell a house in midtown Toronto?
In August 2026 detached houses averaged 19 days on market in C10 and C11, 21 in C04, 33 in C03, 56 in C09 and 70 in C02, against 30 across the City of Toronto. The short times belong to houses priced from recent sales; overpriced houses in the larger price bands sat much longer.
What is the average price of a semi-detached house in midtown Toronto?
Across the six districts, 20 semis sold in August 2026 at an average of $1,658,511 (my arithmetic from TRREB’s district rows). District medians ranged from $1,150,000 in C04, on a single sale, to $2,100,000 in C02. Toronto Central’s semi median was $1,110,000. These are small samples, so treat them as indicators.
Is now a good time to sell my house in midtown Toronto?
It depends on your plans more than on the month. In August 2026 midtown had about 4.6 months of detached inventory and roughly 44 percent of new listings sold (my arithmetic), close to balanced. Leaside-area C11 was tight; C02 and C09 favoured buyers. Pricing from recent comparable sales matters more than timing.
How much land transfer tax does a buyer pay on a midtown house?
Both Ontario and Toronto tax apply. By my arithmetic from the published brackets, a $2,356,850 house, C04’s August 2026 median, carries $45,396.25 in each, $90,792.50 in total. On a $4,140,000 house the Toronto tax rises to $113,105 because of the luxury rates above $3 million.
Sources
- TRREB — Market Watch, August 2026 — detached, semi-detached and freehold townhouse tables, and the MLS HPI benchmark
- Government of Ontario — Calculating land transfer tax — provincial brackets
- City of Toronto — Municipal Land Transfer Tax rates and fees — Toronto only
- Government of Ontario — Land transfer tax refunds for first-time homebuyers — up to $4,000
- MPAC — Assessment cycle — 2026 taxes still based on 1 January 2016 values
- CRA — Reporting the sale of your principal residence — report the sale even when fully exempt
Related reading
- How much is my house worth in North York?
- How much is my house worth in the West End?
- How much is my house worth in the East End?
- How much is my condo worth in midtown Toronto?
- What is my home worth in Toronto and the GTA?
- Choosing a realtor in Toronto
- Lawrence Park and Bedford Park home values
- How lot size and frontage drive value in Toronto
About the author — Jatin Dua, Toronto and GTA real estate broker
I am Jatin Dua, Broker of Record and co-founder of RE/MAX Quantum Realty Inc., Brokerage, Unit 101, 799 The Queensway, Toronto. I work with buyers and sellers across Toronto and the GTA and have helped more than 100 families sell. Four-plus years of active GTA transactions and over $100 million in sales volume. Every figure here comes from a published table, regulator or statute linked in the sources, so you can check all of it without asking me.
Reach me at connect@jatindua.com or 833-330-1925, or book a call.